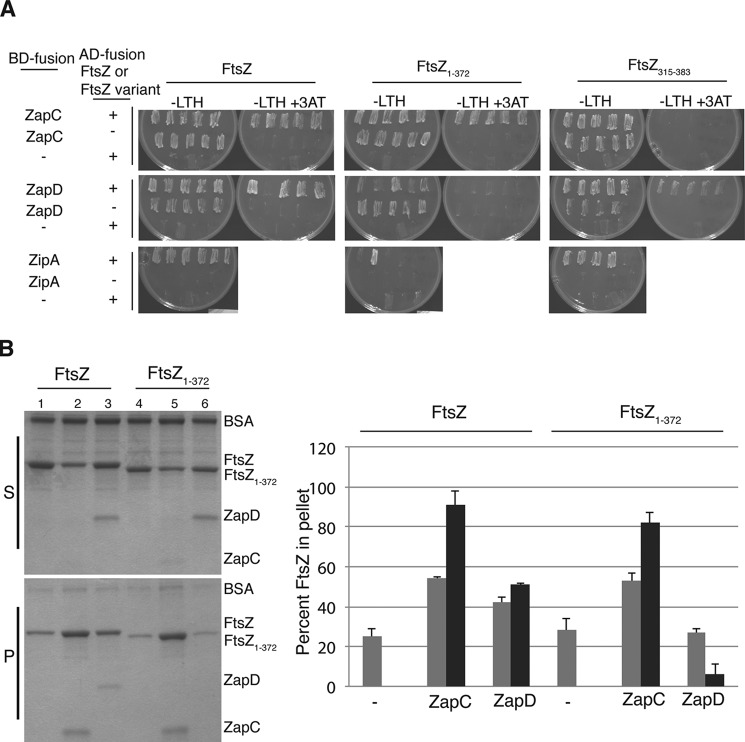
FIGURE 7.
ZapC did not require the FtsZ CTT for interaction with FtsZ. A, interactions between FL ftsZ (pSC3) and ftsZ lacking the C-terminal tail residues (pSC8) fused to activation domains (AD) with WT zapC (pSC2), zapD (pSC15), or zipA (pSC18) fused to binding domains (BD) were visualized by examining the growth of 4–6 diploid yeast colonies patched selectively on YNB media (−LTH) without or with 25 mm 3-amino-1,2,4-triazole (3AT) at 30 °C for 2 days. Note: BD-ZipA fusion alone displayed no background growth in YNB (−LTH) plates, and therefore, FtsZ/ZipA interactions could be scored under those conditions. In contrast, BD-ZapC and BD-ZapD fusions alone showed considerable growth in YNB (−LTH) plates, and therefore interactions could only be scored on YNB (−LTH) with 3-amino-1,2,4-triazole. The – indicates unfused binding or activation domains. B, equivalent aliquots of co-sedimentation reactions in the presence of GTP containing ZapC or ZapD (1 μm) with either FL FtsZ or FtsZ1–372 (5 μm) were separated by SDS-PAGE and visualized. Lane 1, FL FtsZ alone; lane 2, FL FtsZ with WT ZapC; lane 3, FL FtsZ with WT ZapD; lane 4, FtsZ1–372 alone; lane 5, FtsZ1–372 with ZapC; lane 6, FtsZ1–372 with ZapD. The bar graph represents the amounts of FtsZ (gray), ZapC, or ZapD (black) proteins that were recovered in the pellets. Band intensities were measured using Image J. Average and S.D. values of three independent experiments are reported. S, supernatants; P, pellets; - indicates FtsZ alone.

