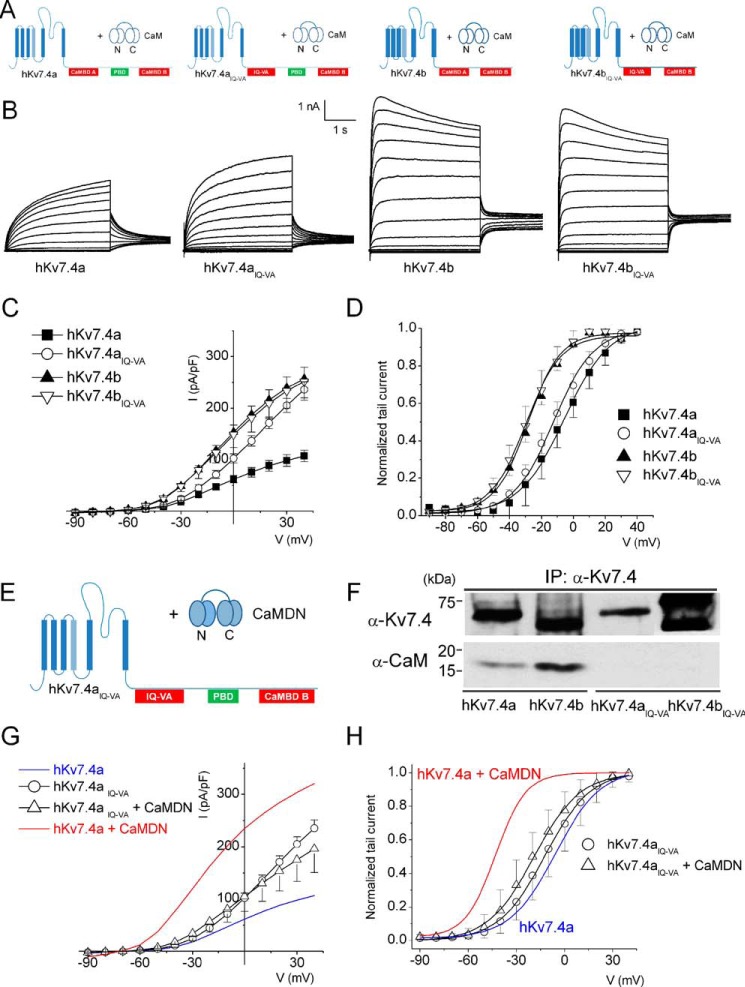
FIGURE 3.
The IQ motif in CaMBDA is necessary but not sufficient for Ca2+/CaM-dependent inhibition of the hKv7.4 current. A, the combinations of hKv7.4 and MT hKv7.4IQ-VA isoforms with endogenous CaM. B, representative current traces of hKv7.4 and hKv7.4IQ-VA recorded from transfected CHO cells. Whole-cell recordings were generated from a holding potential of −70 mV to step potentials ranging from −90 to 40 mV using voltage increments of 10 mV. Tail currents were recorded at −30 mV. C, plots of current density (picoampere/picofarad)-voltage relations were generated from CHO cells expressing hKv7.4 and hKv7.4IQ-VA isoforms (n = 19). I, current. D, normalized tail currents of hKv7.4 (hKv7.4IQ-VA) isoforms were plotted against applied voltages to generate activation curves that were fitted with the Boltzmann function. The V½ (in millivolt) and k values for hKv7.4a and hKv7.4aIQ-VA were as follows: −5.7 ± 1.1 and 14.1 ± 0.9 (n = 17), and −12.2 ± 0.5 and 11.4 ± 0.5, respectively (n = 17). For hKv7.4b and hKv7.4bIQ-VA, the V1/2 and k values were as follows: −28.4 ± 2.0 and 10.1 ± 1.2 (n = 17) and −29.7 ± 1.2 and 10.9 ± 1.0, respectively (n = 17). E, schematic of the experiment performed with hKv7.4aIQ-VA + CaMDN. F, co-immunoprecipitation (IP) experiment showing that association of hKv7.4IQ-VA isoforms with CaM was abolished. G, current density (in picoampere/picofarad)-voltage relations of hKv7.4aIQ-VA alone and hKv7.4aIQ-VA + CaMDN (n = 17). H, normalized tail currents for hKv7.4aIQ-VA were plotted against the applied voltage to generate activation curves fitted with a Boltzmann function. The V½ (in millivolt) and k values for hKv7.4aIQ-VA were as follows: −12.2 ± 0.5 and 11.4 ± 0.5 (n = 17); and for hKv7.4aIQ-VA + CaMDN they were −19.0 ± 0.7 and 11.8 ± 0.7, respectively (n = 17). Blue and red curves denote data from Fig. 1D for comparison with hKv7.4a and hKv7.4 + CaMDN, respectively.

