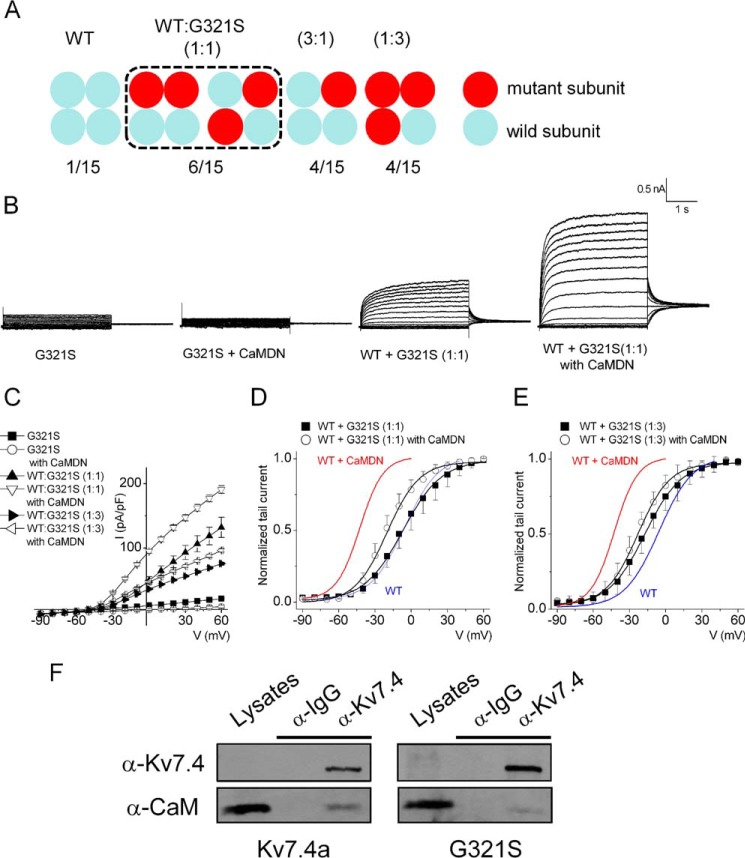
FIGURE 4.
Co-expressing the hKv7.4a G321S MT subunit with the WT subunit reduces current density but attenuates the effect of CaMDN on the activation curve. A, schematic of expected channel combinations with hKv7.4a WT and G321S MT type subunits. The numbers presented at the bottom show the potential membrane-expressed channel populations formed from each different ratio of WT and MT subunit. B, representative traces show the whole-cell recording from CHO cells transfected with hKv7.4a WT and G321S MT subunits in a 1:1 ratio (WT:G321S) with either empty vector or CaMDN. The current traces were recorded from a holding potential of −70 mV to step potentials ranging from −90 to 60 mV using voltage increments of 10 mV. Tail currents were recorded at −30 mV. C, plots of current density (picoampere/picofarad)-voltage relations of currents were derived from CHO cells expressing different combinations of hKv7.4a G321S alone, hKv7.4a + CaMDN, 1:1 or 1:3 ratio of (WT:G321S) alone, or with CaMDN. D and E, normalized tail currents of 1:1 ratio (WT:G321S) alone and 1:1 ratio (WT:G321S) + CaMDN are plotted on each voltage applied and generated the activation curves fitted with a Boltzmann function. Blue and red curves denote data from Fig. 1D for comparison with hKv7.4a and hKv7.4 + CaMDN, respectively. F, CHO cells were expressed with either hKv7.4a or hKv7.4a G321S for 24 h. After preparation of cell lysates, immunoprecipitation was accomplished with Kv7.4 antibody to test CaM binding to the channel subunit.

