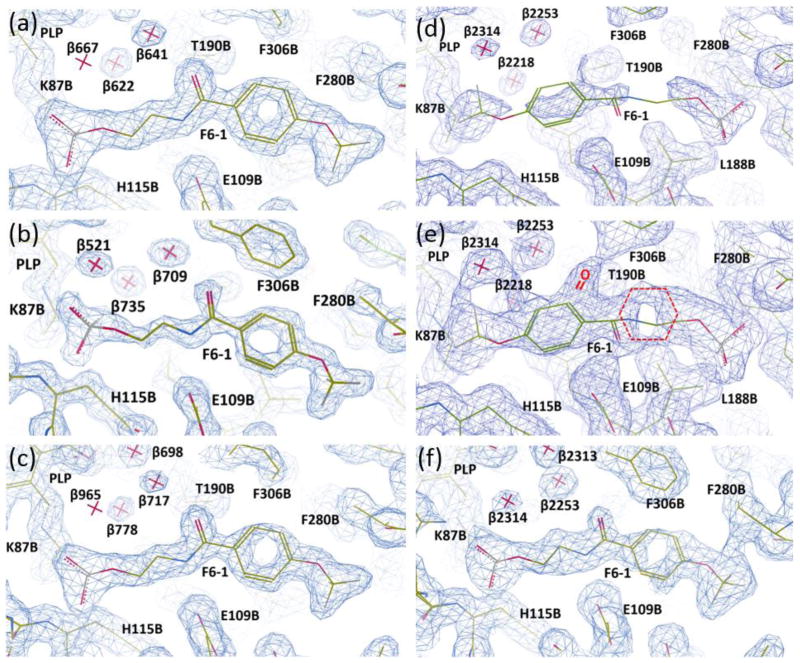
Figure 2.
Representations of the electron density maps for the F6-1 binding site in the β-subunit PDB IDs: 4WX2, 4ZQC, 4Y6G, 2CLF, and rr2CLF. (a) PDB ID: 4WX2; (b) PDB ID: 4ZQC; (c) PDB ID: 4Y6G; (d–e), PDB ID: 2CLF; (e), re-refined model rr2CLF. Sections of the electron densities contoured at 1.2 rms (a–d), 0.5 rms (e), and 0.7 rms (f) from the 2Fo-Fc maps. The coordinate and structure factor files were loaded in Coot 0.8.1. The Fo-Fc electron density maps were deactivated and the clipping planes (a.k.a. “slab”) were adjusted to improve the visualization of the electron density of interest surrounding each F6-1 molecule.

