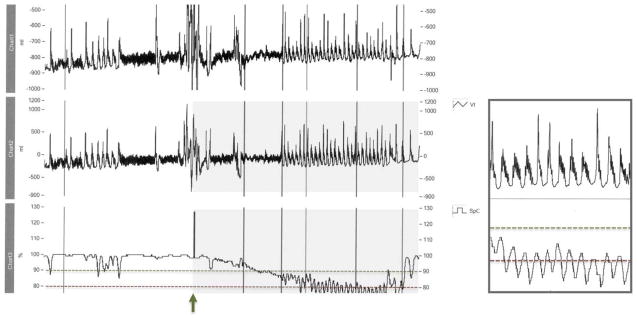
Figure 2.
Diagram showing a 5-minute recording from a patient who failed the challenge. The upper 2 tracings show respiratory excursions. The lowest tracing is SpO2% averaged every 3 to 5 sec. Note the stable SpO2% > 90% when respirations are regular. Note the intermittent hypoxemia and characteristic oscillations in SpO2% seen with the brief run of periodic breathing early in the tracings, and the continuous oscillations when PB is established. This pattern occurred in 43.2% of challenge failures. For this subject, continuous periodic pattern was associated with failure-range falls in SpO2% to < 80%.
First vertical mark: challenge begun, followed by brief run of periodic breathing. 2nd vertical mark: quiet sleep. 6th vertical mark: RAC failure was declared. The smaller box is an enlarged 30 sec excerpt from between vertical marks 5 and 6.

