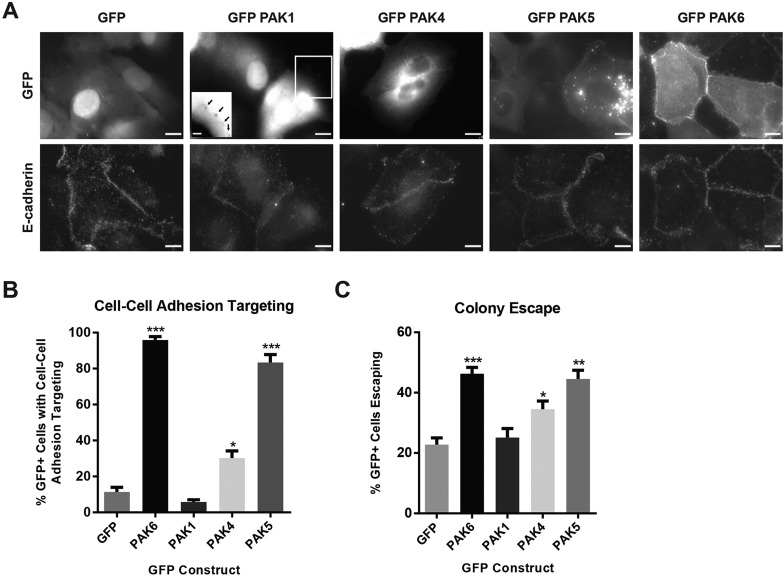
Fig. 8.
PAK isoform differential targeting correlates with ability to drive epithelial colony escape. (A) Stable DU145 cell lines expressing the indicated PAK isoforms were plated on glass coverslips, fixed after 24 h and stained for E-cadherin (DECMA-1). Inset depicts color-inverted, enlarged image of GFP–PAK1 targeted to focal adhesions, marked by arrows. Scale bars: 10 µm. (B) Mean percentage (±s.e.m.) of cells in which GFP-tagged constructs targeted to cell–cell adhesions; n=3 with ≥40 cells per experiment. (C) Quantification of colony escape assay, showing the mean percentage (±s.e.m.) of GFP+ cells escaping colonies. n=3 with ≥50 cells per experiment. *P<0.05, **P<0.01, ***P<0.001.

