Fig. 3.
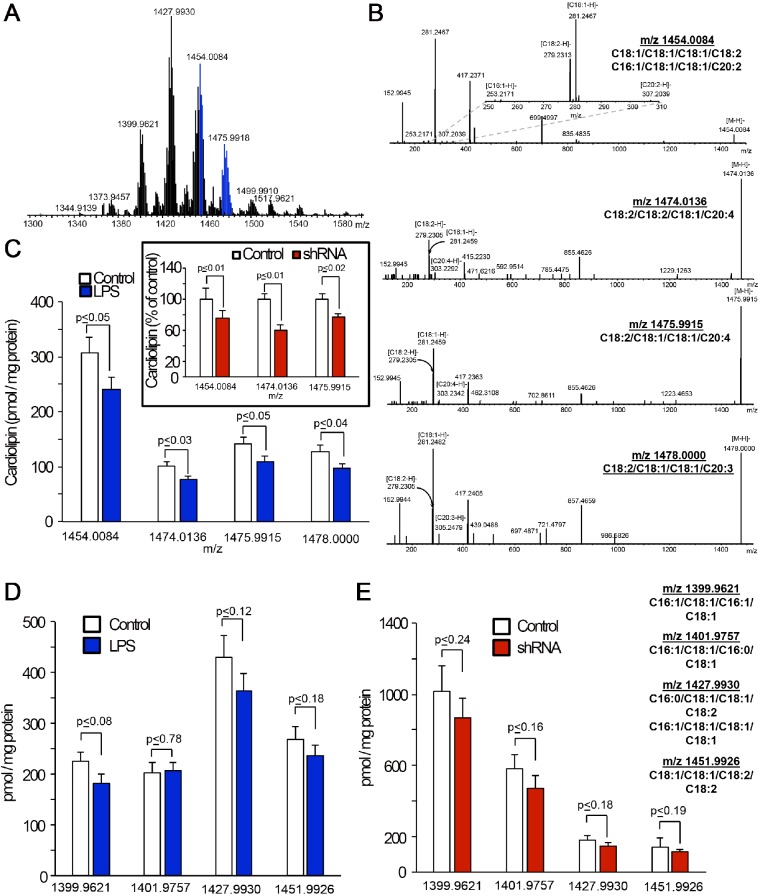
Silencing of Alcat1 or treatment with LPS decreases C20-containing cardiolipin molecular species in MLE cells. (A) Typical mass spectrum of cardiolipins obtained from MLE cells. Signals from C20-containing molecular species of cardiolipins are highlighted in blue. (B) Fragmentation patterns from tandem mass spectrometry analyses of C20-containing molecular species of cardiolipin [m/z 1454.0084, 1474.0136, 1475.9915 and 1478.0000 (top to bottom)] in MLE cells. Upper panel inset, a zoomed segment of a tandem spectrometry spectrum of cardiolipin molecular species with m/z 1454.0084 in the m/z range 250 to 310 showing the signals from [C18:2-H]− and [C18:1-H]− [C16:1-H]− and [C20:2-H]− ions. (C) Quantitative assessments of C20-containing molecular species of cardiolipin in MLE cells that had been treated with LPS (4 µg/ml, 16 h, 37°C) or shRNA (inset). Quantitative LC-MS analysis of the cardiolipin species with the indicated m/z (x-axis) in MLE cells that had been treated with LPS (D) or Alcat1 shRNA (E). Data are mean±s.d., n=3.

