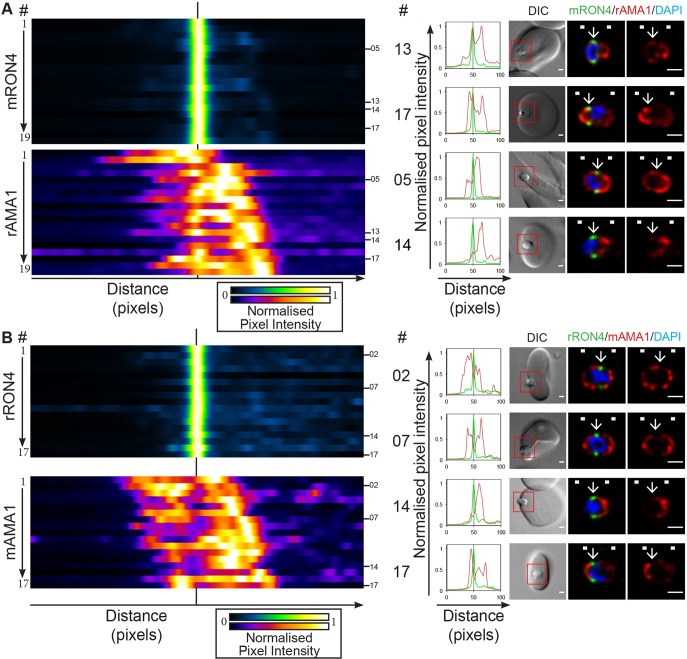
Fig. 2.
Longitudinal intensity profiling demonstrates antibody-specific variation in AMA1 detection at the tight junction. Heatmaps, normalised intensity plots and single-slice images of example merozoites for the longitudinal intensity profiling of (A) mRON4 (green) versus rAMA1 (red) or of (B) rRON4 (green) versus mAMA1 (red) antibody labelling. The boxed regions in DIC images are shown magnified to the right. Arrows indicate the position of the RON4-labelled tight junction. White boxes denote approximate front and back position of merozoite as determined in the DIC channel. See also Fig. S1B,C. Scale bars: 1 μm.

