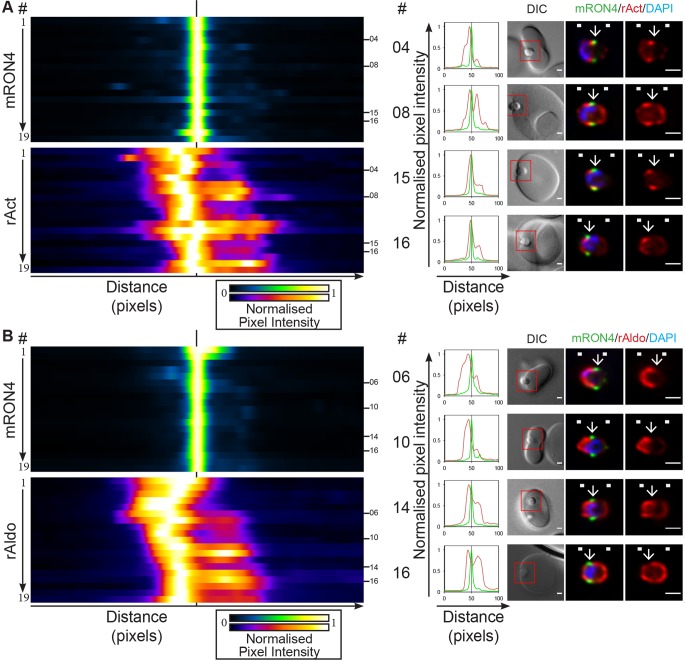
Fig. 3.
Longitudinal intensity profiling localises actin and aldolase towards the rear of the invading merozoite tight junction. Heatmaps, normalised intensity plots and single-slice images of example merozoites for the longitudinal intensity profiling of mRON4 (green) versus (A) rabbit actin (rAct; red) or (B) rabbit aldolase (rAldo; red) antibody labelling. The boxed regions in DIC images are shown magnified to the right. Arrows indicate the position of the RON4-labelled tight junction. White boxes denote approximate front and back position of merozoite as determined in the DIC channel. See also Fig. S1D,E. Scale bars: 1 μm.

