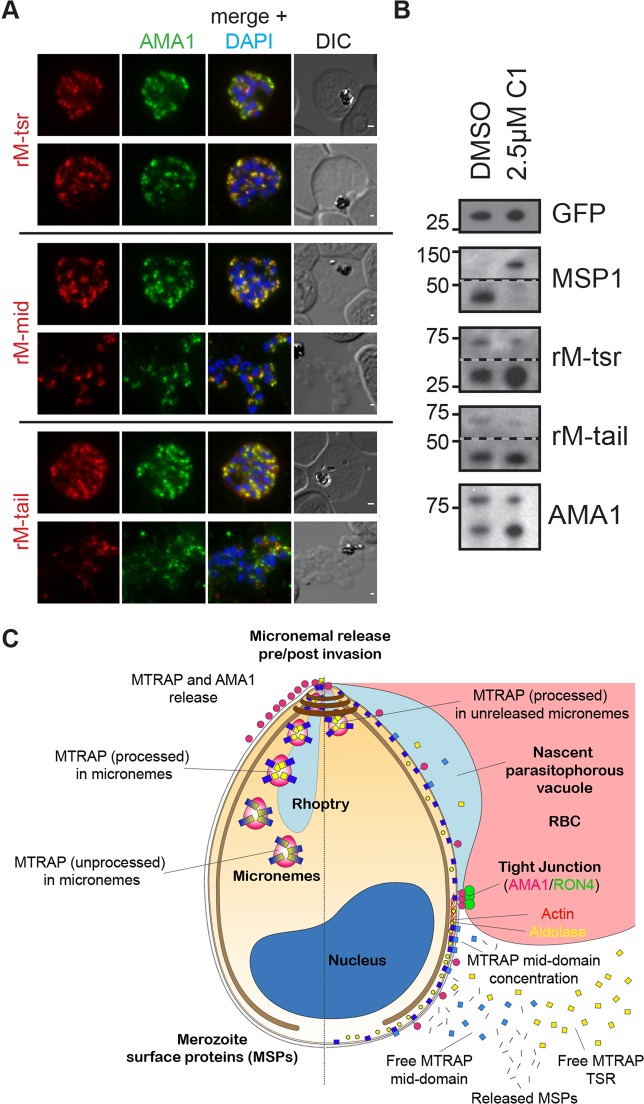
Fig. 7.
MTRAP is cleaved within the micronemes. (A) Immunofluorescence analysis of Compound 1 (C1)-treated schizonts (versus DMSO control) co-labelled with mAMA1 (green) and rM-tsr (top), rM-mid (middle) or rM-tail (bottom) (red in respective images) antibodies. Scale bars: 1 μm. (B) Immunoblot analysis of tightly synchronised late-stage schizont and early ring parasites labelled for GFP (loading control), MSP1 (C1 treatment control), rM-TSR, rM-tail and rAMA1. (C) Schematic of pre- (left half) and post- (right half) invasion merozoites, showing the predominant distribution of each protein examined as part of this study. It should be noted that all proteins show a degree of variability in labelling distribution across merozoites.

