Fig. 3.
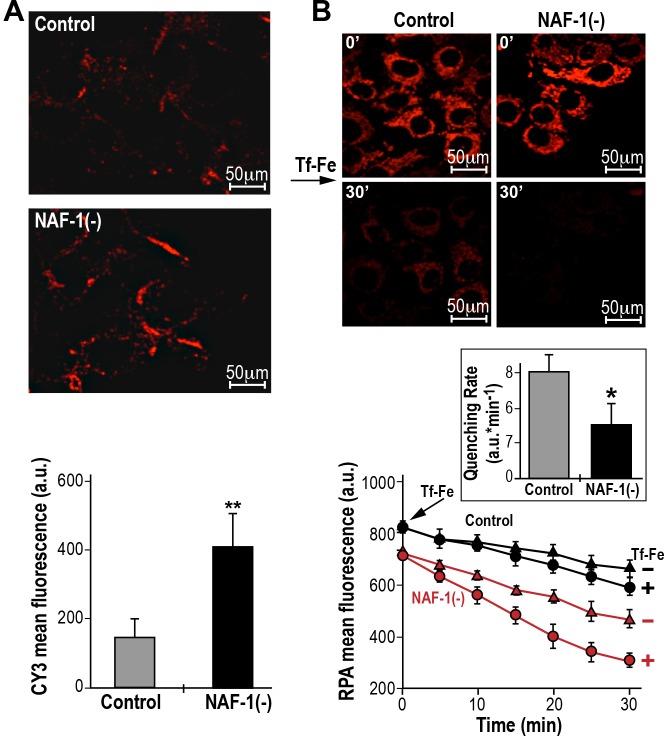
Elevated levels of TfR and Fe ion uptake into mitochondria in NAF-1(−) MCF-7 cells. (A) Elevated levels of the TfR protein on the membranes of NAF-1(−) cells. Top, semi-confocal microscopy images of NAF-1(−) cells and control cells. Cells were immunostained with an antibody against transferrin and counterstained with Cy3 (red). Bottom, quantitative representation of mean fluorescence intensity (5 cells/field; n=3 independent experiments); **P<0.01 (t-test). (B) Elevated Fe ion uptake into mitochondria of NAF-1(−) cells. Mitochondria were loaded with red fluorescent RPA (which undergoes quenching upon binding of Fe ions), exposed to transferrin-bound Fe ions (Tf-Fe; 2 µM) and imaged over time. Top, semi-confocal microscopy images of NAF-1(−) and control cells control cells following 30 min of incubation with transferrin-bound Fe ions. Middle, bar graph showing the corrected slopes for net quenching associated with administration of transferrin-bound Fe ions [fluorescence (a.u.)×min−1±s.e.); *P<0.05 (t-test). Bottom, line graphs showing the rates of quenching [iron ingress; fluorescence (a.u.)×min−1], calculated for n=3 independent experiments. Error bars represent mean ±s.d.

