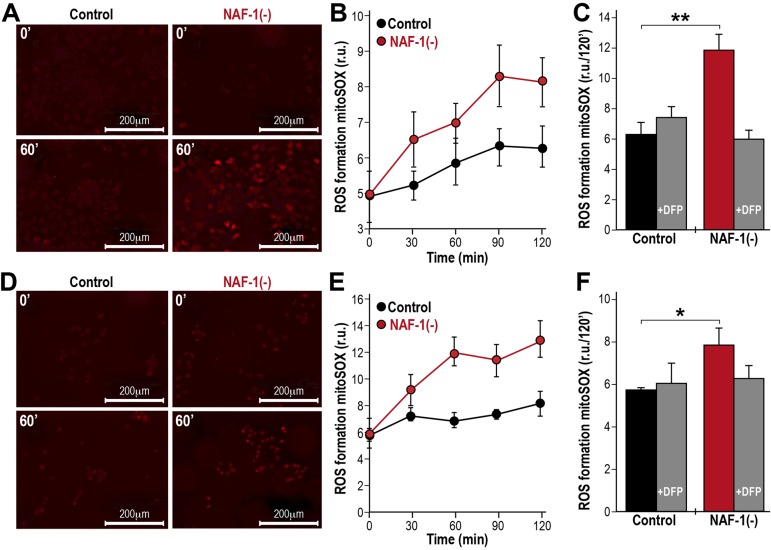
Fig. 4.
Enhanced mitochondrial ROS production in NAF-1(−) cells. (A) Images of mitoSOX-loaded control and NAF-1(−) MDA-MB-231 cells at 0 and 60 min of incubation. (B) Line graph showing a time-course of the change in mitoSOX fluorescence in mitoSOX-loaded control and NAF-1(−) MDA-MB-231 cells. (C) Bar graph showing the suppression of mitochondrial ROS production in mitoSOX-loaded control and NAF-1(−) MDA-MB-231 cells at 120 min of incubation by pretreatment with DFP (100 μM). (D–F) As A–C but using MCF-7 cells. n=3 independent experiments; *P<0.05, **P<0.01 (t-test). r.u., relative units. Error bars represent mean±s.d.

