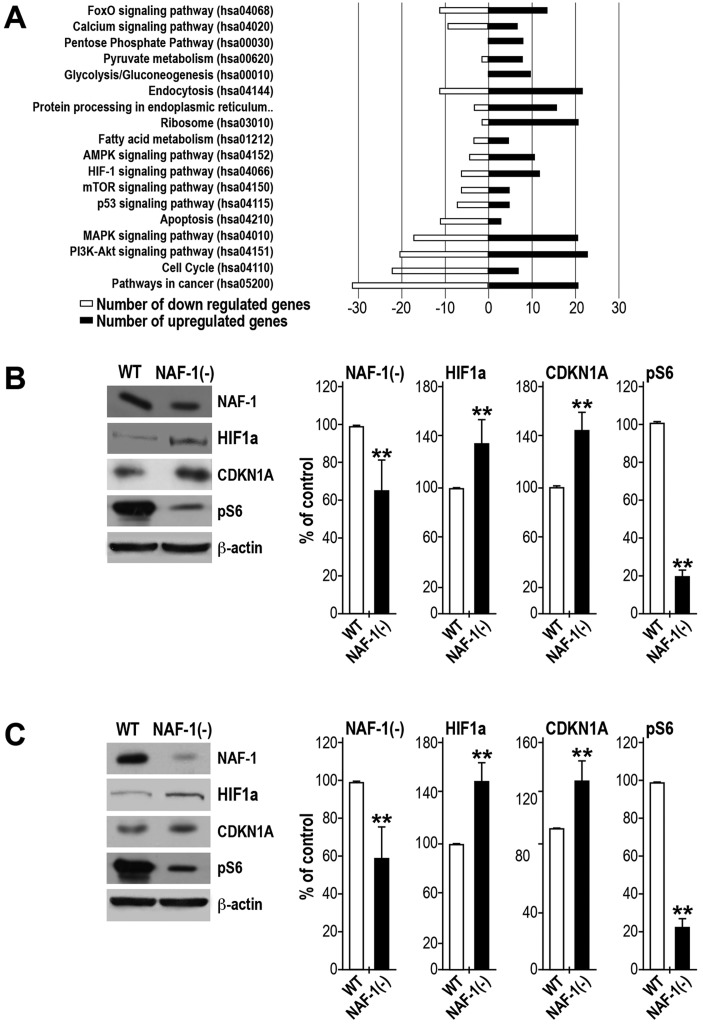
Fig. 7.
Activation of stress and cellular survival pathways in cancer cells in which NAF-1 express has been suppressed. (A) Differentially expressed genes in NAF-1(−) MCF-7 cells relative to those in MCF7 negative controls that are found in KEGG human-specific signaling pathways. Black bars represent the number of genes of which the expression is increased in each pathway, and white bars represent the number of genes of which the expression is decreased in each pathway. (B,C) Western blot analysis and quantification (bar graphs) of wild-type (WT) and NAF-1(−) MCF-7 (B) or MDA-MD-231 (C) cells showing the protein levels of NAF-1, HIF1α, CDKN1A and pS6. β-actin was used as a loading control. Protein expression was calculated as a percentage of that of control from three different experiments. **P<0.01 (t-test), n=3.

