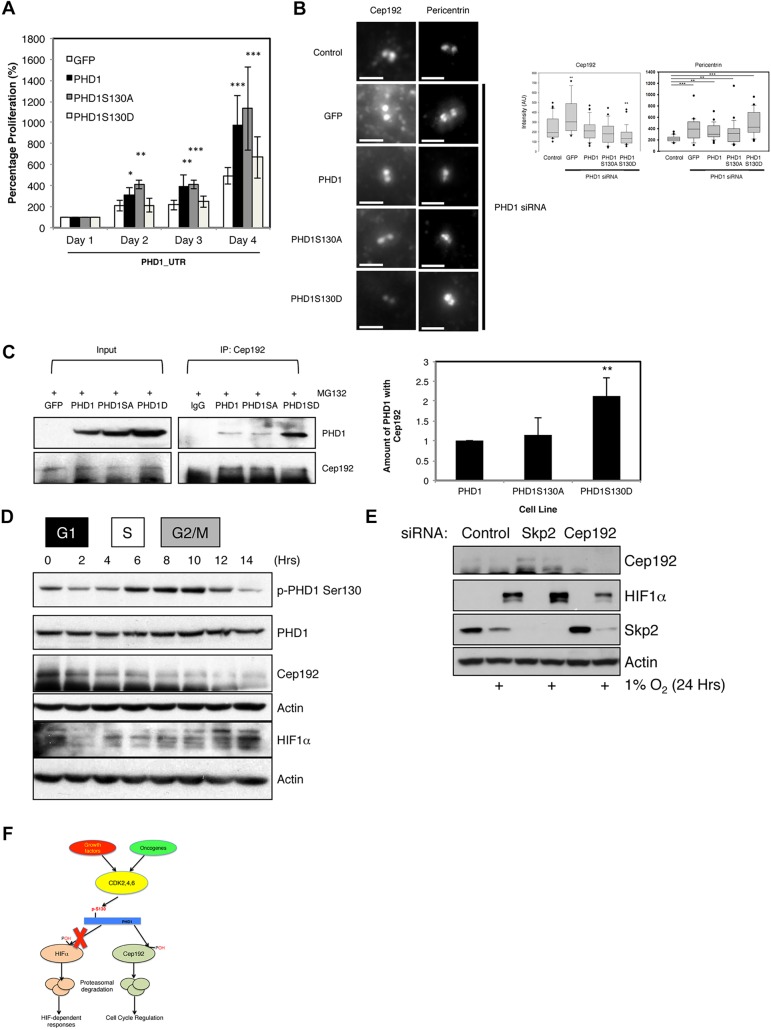
Fig. 6.
S130 of PHD1 is important for PHD1-mediated control of cell proliferation. (A) U2OS GFP, PHD1–GFP, PHD1-S130A–GFP and PHD1-S130D–GFP cells were transfected with siRNA oligonucleotides targeting the 3′UTR of endogenous PHD1 prior to proliferation being assessed. Total cell numbers were counted, and the graph depicts mean±s.d. of a minimum of three independent experiments. Data were normalised to proliferation in GFP cells and expressed as a percentage. (B) U2OS GFP, PHD1GFP, PHD1-S130A–GFP and PHD1-S130D–GFP cells were transfected with siRNA oligonucleotides targeting the 3′UTR of endogenous PHD1 prior to fixation and immunostaining for Cep192 and pericentrin. Scale bars: 2 µm. Graph depicts box-and-whisker plots for Cep192 and Pericentrin intensity. Box-and-whisker plot, middle line shows the median value; the bottom and top of the box show the lower and upper quartiles (25-75%); whiskers extend to 10th and 90th percentiles, and all outliers are shown. n=22–38 cells per condition. (C) U2OS GFP, PHD1GFP, PHD1-S130A–GFP and PHD1-S130D–GFP cells were treated with MG132 for 3 h prior to lysis. 300 µg of cell extracts were used to immunoprecipitate (IP) Cep192, with normal mouse IgG used as a control. Precipitated material was analysed by western blotting for the indicated proteins. Western blots were quantified and the graph depicts mean±s.d. of a minimum of three independent experiments. (D) Cell extracts from Fig. 3A were analysed by western blotting for the levels of Cep192 and HIF1α. G1, S, and G2/M are the phases of the cell cycle that correspond to the indicated time points. (E) U2OS were transfected with the indicated siRNAs prior to treatment with 1% O2 for 24 h. Whole-cell lysates were analysed by western blotting using the depicted antibodies. (F) Schematic diagram for the proposed model for PHD1 regulation by CDKs. *P<0.05, **P<0.01 and ***P<0.001 compared to control (Student's t-test). See also Fig. S4.

