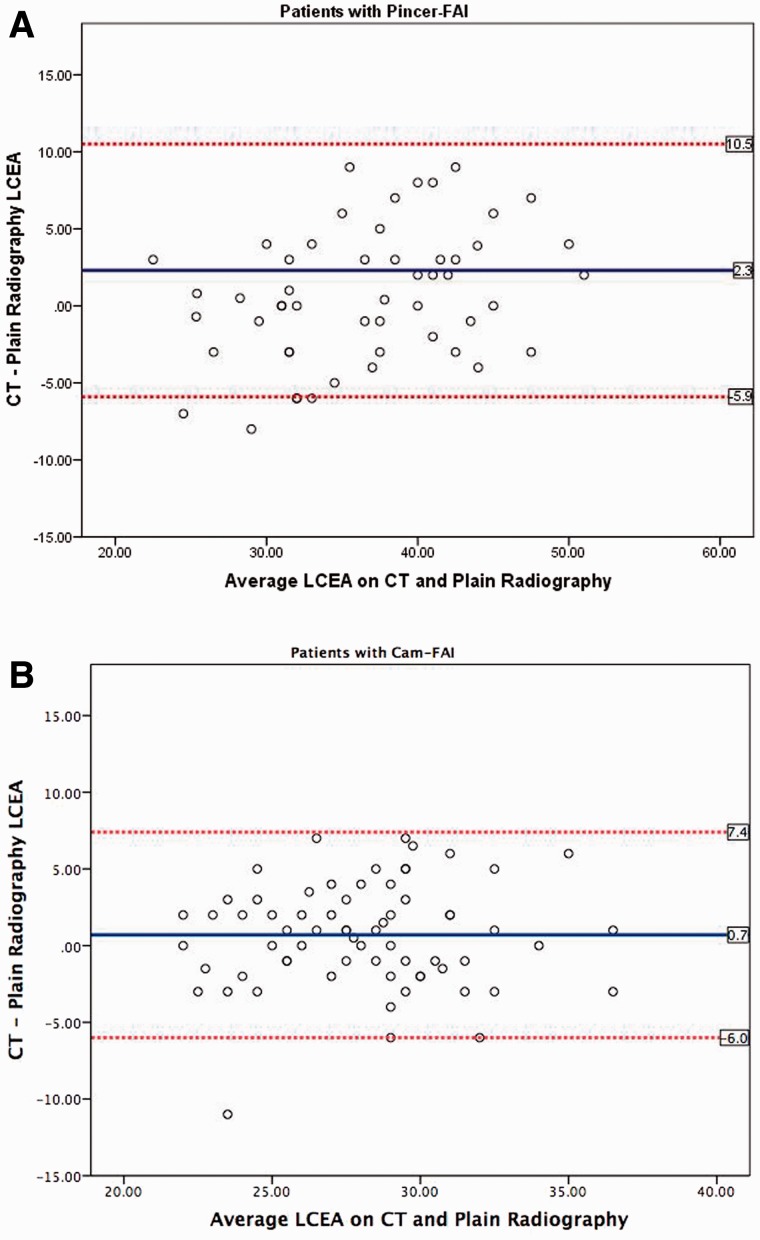
Fig. 1.
Bland–Altman plots depicting the variability of measurements of LCEA on plain radiography versus CT in patients with (A) pincer-FAI and (B) cam-FAI. The mean difference between measurements of LCEA on CT and plain radiography (blue line) is nearly 0; however, plotting of the data reveals a relatively even spread of measurements that were greater on plain radiography compared with CT. This is in contrast to the trend observed for all other clinical subgroups, in which measurement of LCEA was uniformly inflated on CT relative to plain radiography.

