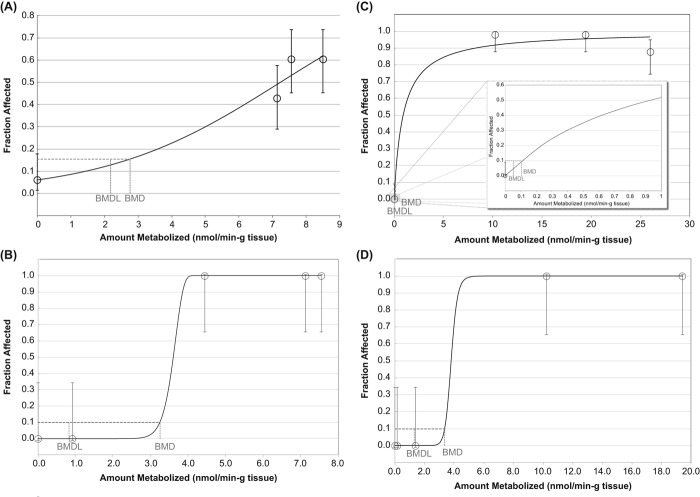
Figure 4.
Two-year (NTP 2000) vs 90-day (Dodd et al. 2012) metabolized dose–response in male and female rats following naphthalene exposure via inhalation (BMR of 10% extra risk for the 0.95 lower confidence limit on the BMD). Figures show the best-fit curve. See supplemental material for all modeling results. (A) Male rat respiratory epithelial hyperplasia dose–response from 2-year study (Logistic); (B) male rat respiratory epithelial hyperplasia dose–response from 90-day study (Weibull); (C) female rat olfactory epithelial hyperplasia dose–response from 2-year study (Log-Logistic with NO FIT); (D) female olfactory epithelial hyperplasia dose–response from 90-day study (Log-Logistic).

