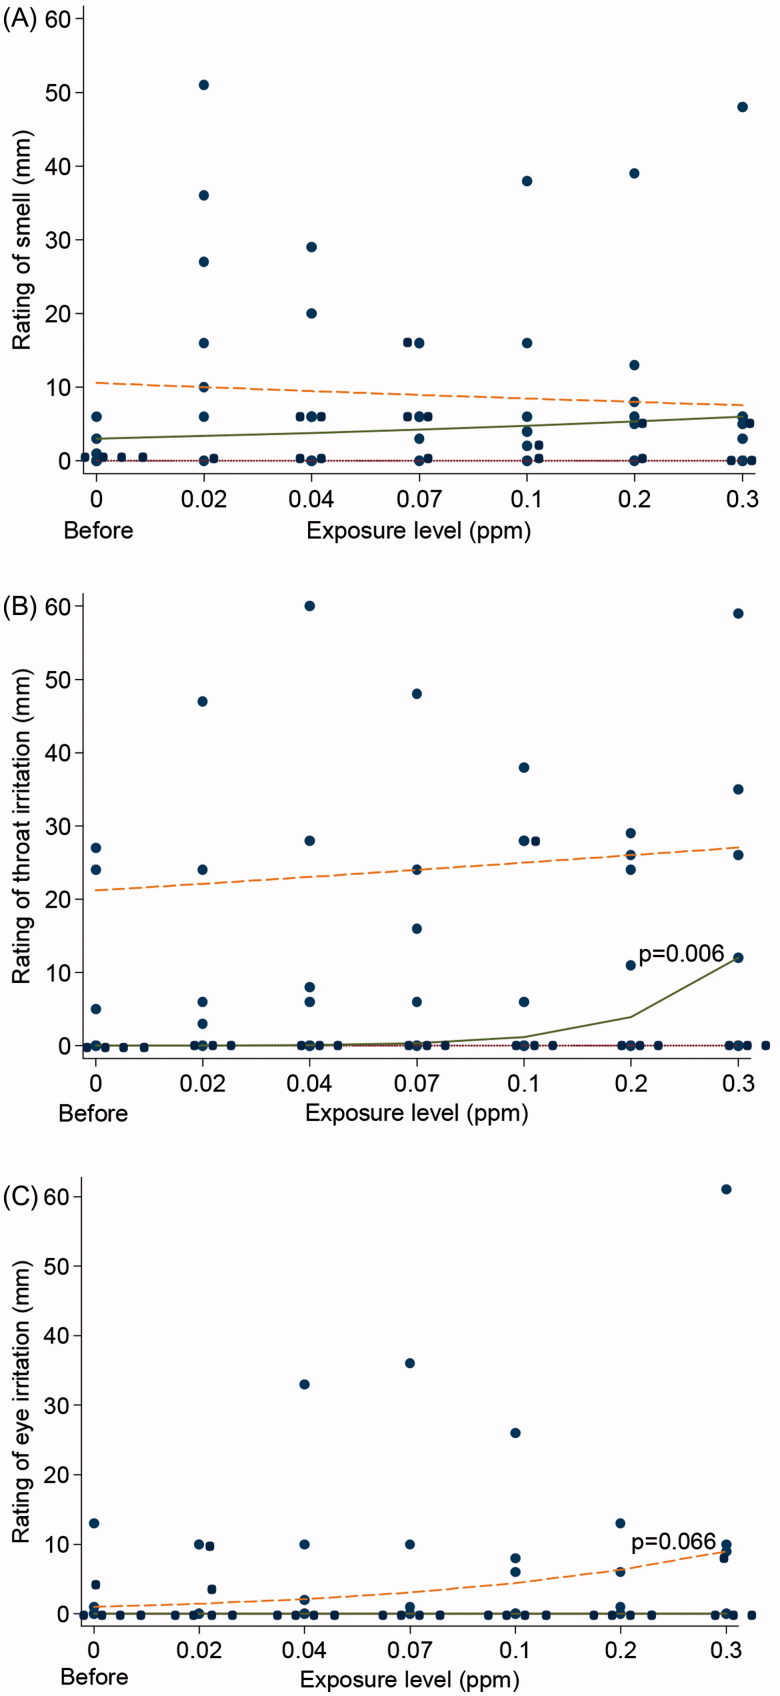
Figure 1.
Ratings of smell (A), irritation in the throat (B), and irritation in the eyes (C) by Visual Analogue Scale (VAS) in eight volunteers in the pilot study with stepwise increasing concentrations of acrolein (10 min per step). The curves represent the 25th, 50th (median), and 75th percentile. Logistic quantile regression analysis revealed significant increased throat irritation (p = 0.006) for the 50th percentile and a tendency of increased eye irritation (p = 0.066) for the highest percentile.

