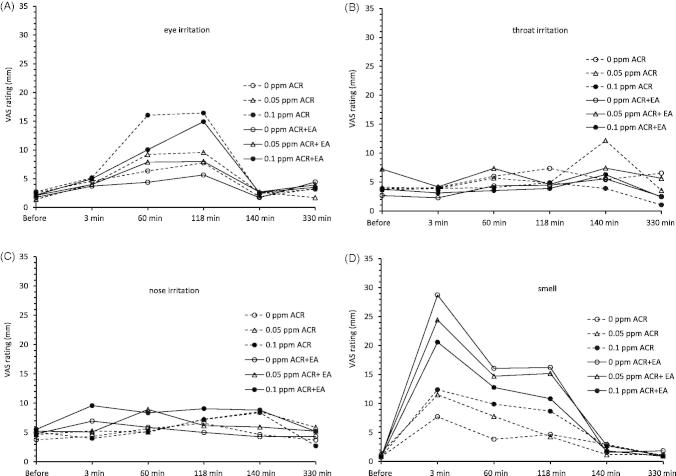
Figure 2.
Average ratings of eye irritation (A), nose irritation (B), irritation in the throat (C), and smell (D), in 18 volunteers before, during, and after 2 h exposure to 0 ppm (control), 0.05 ppm and 0.1 ppm acrolein (ACR) and to ethyl acetate (EA 15 ppm), EA + 0.05 ppm ACR and EA + 0.1 ppm ACR. The dotted curves indicate exposure to ACR only, the solid curves EA + ACR.

