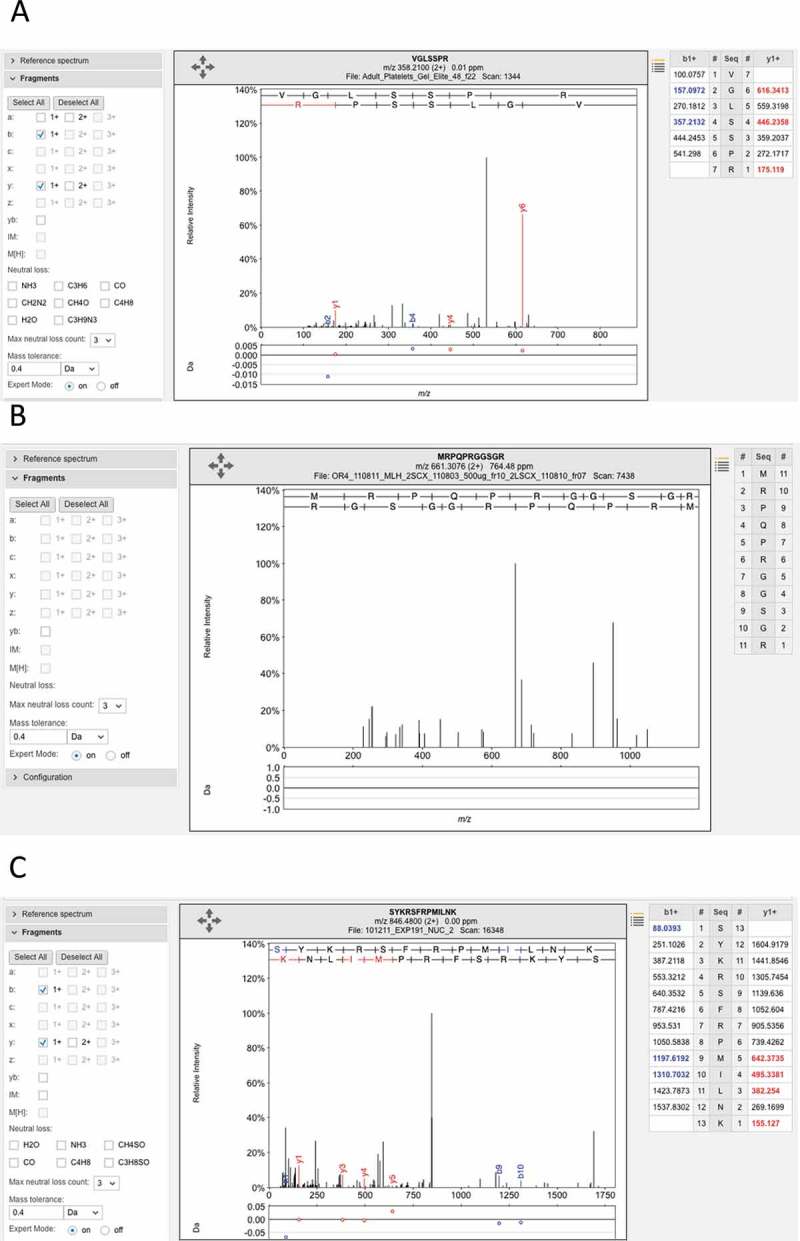
Figure 5.

Examples of the many poor spectra from the Wilhelm analysis. (A) One of the three poor spectra used to identify peptide VGLSSPR for gene LINC00346. This peptide was identified with an Andromeda score of 71.95. No consecutive ions in the series were identified. (B) The very poor spectrum for peptide MRPQPRGGSGR, which maps to gene LINC00346. The peptide is supposed to be N -terminal acetylated. None of the fragments are identified. C. One of three poor spectra for peptide SYKRSFRMILNK, which is used to identify EBLN2. Again very few fragments are identified. All these spectra are from the ProteomicsDB and from the Wilhelm analysis.
