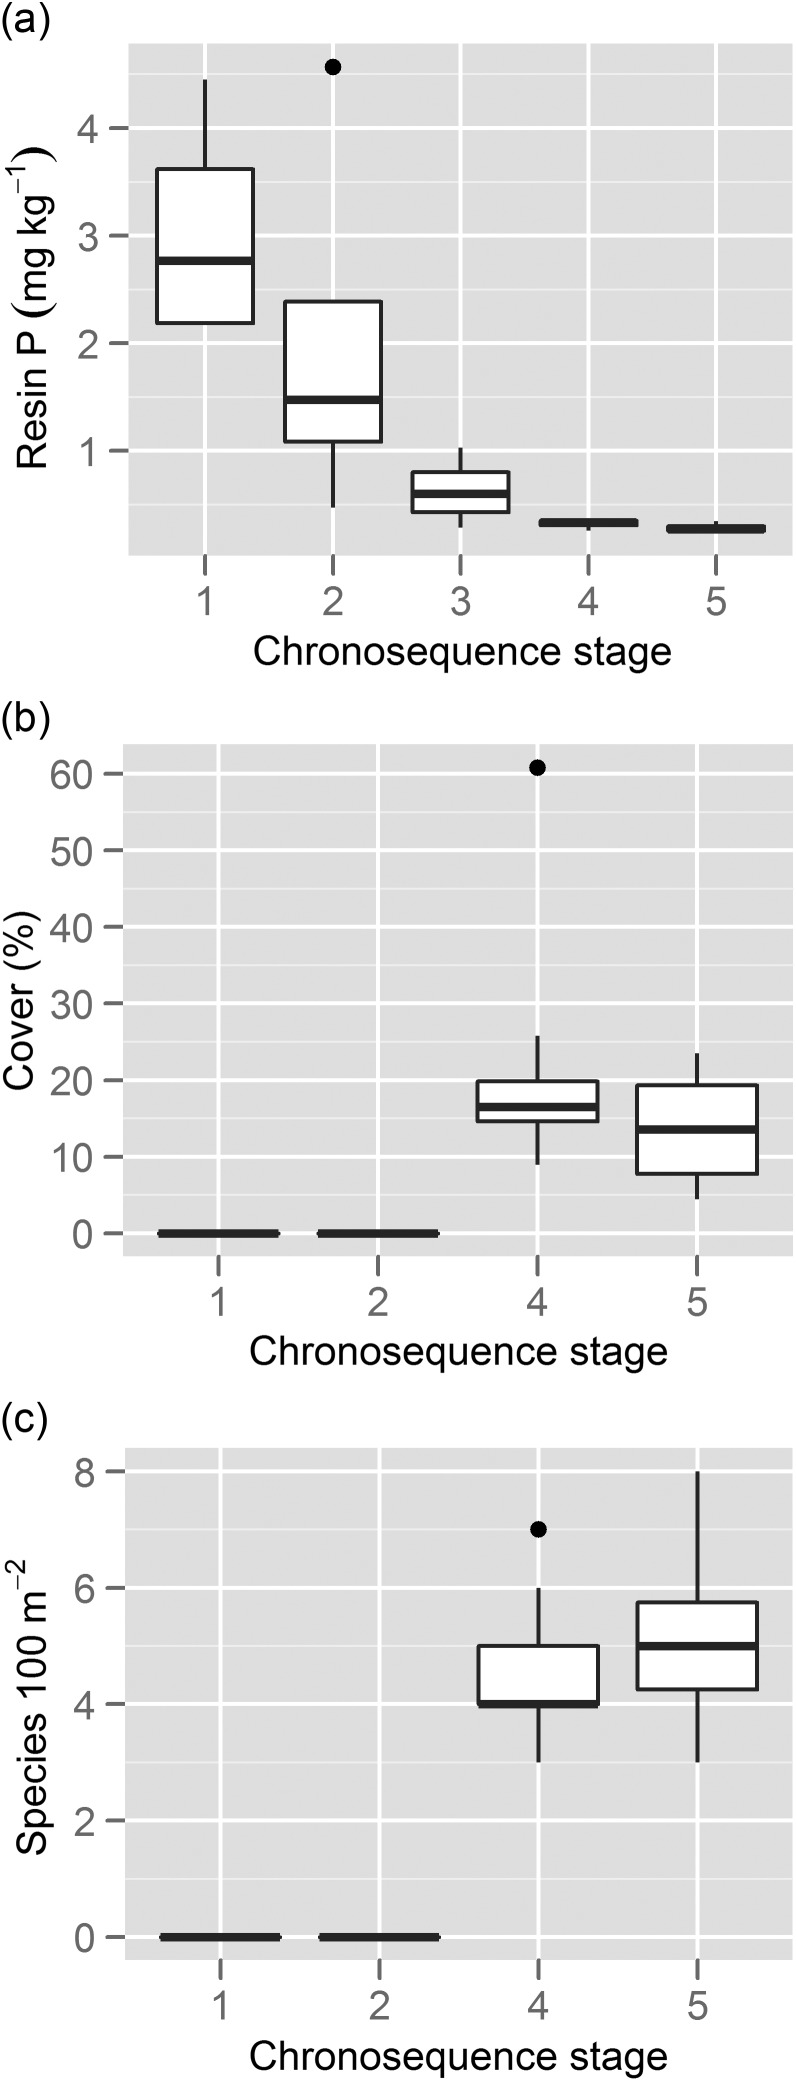
Figure 3:
Changes in resin P (i.e. readily available P; a), percentage canopy cover of Proteaceae species (b), and species richness of Proteaceae (c) along five stages of the Jurien Bay 2 million year dune chronosequence in south-western Australia (Laliberté et al., 2012). Data for (a) are from Laliberté et al. (2012), whereas data for (b) and (c) are from 50 10 m × 10 m plots (i.e. five chronosequence stages × 10 replicate plots) of a recent vegetation survey (G. Zemunik; unpublished data). Stages 1–3 represent Holocene (<7000 years) dunes, whereas stages 4–5 represent Pleistocene dunes (>120 000 years; Laliberté et al., 2012).

