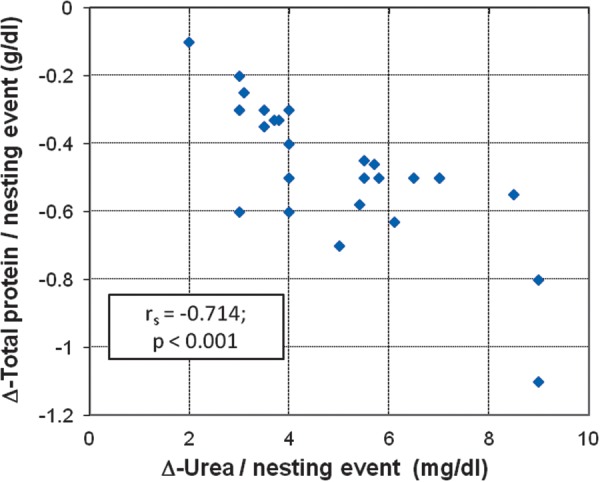
Figure 3:

Scatter plot and Spearman rank correlation between the rates (Δ) of urea and total protein per nesting event for reproductive female hawksbill turtles observed nesting twice or more in a single season (n = 27). The scatter graph shows a negative correlation between the variables; urea tends to increase as total protein decreases, which indicates muscle protein catabolism throughout nesting period. Rates (Δ) were obtained from the slope of the regression line, with the number of nesting events varying from two to five times within a nesting season.
