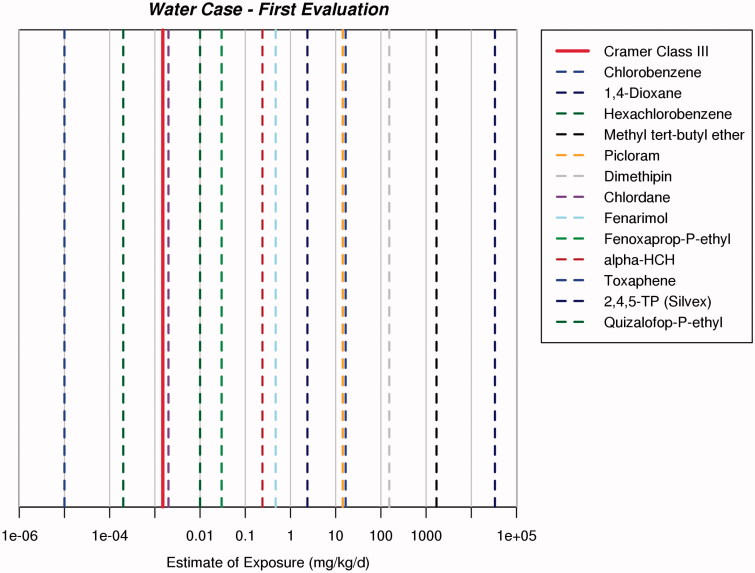
Figure 3.
First evaluation. RISK21 matrix plot illustrating the use of the TTC approach. The 13 chemicals belonging to Cramer Class III (of 20 in total) are plotted to demonstrate exposure (calculated based on solubility) relative to the Cramer Class III threshold of 1.5E-3 and which chemicals (toxaphene & HCB) fall below this value of 3 μg/kg/day. (This illustrates the flexibility of the RISK21 matrix approach.).

