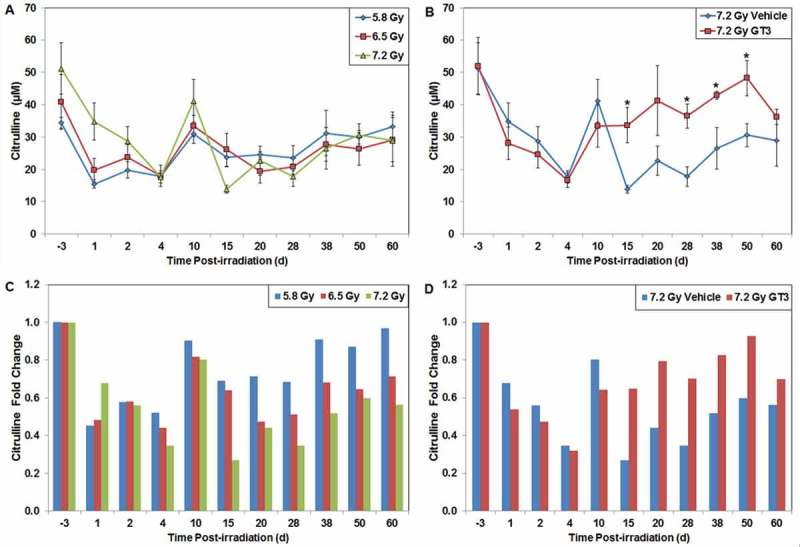
Figure 4.

Effects of radiation exposure and GT3 treatment on the levels of citrulline in peripheral blood. (A) NHPs were irradiated with 5.8 (blue), 6.5 (red), or 7.2 Gy (green, 0.6 Gy/min, 60Co γ-radiation) and blood samples were collected at various time points in relation to irradiation. Plasma citrulline concentrations were quantified using liquid chromatography tandem mass spectrometry. Mean citrulline concentration and standard deviation are displayed. (B) Animal exposed to 7.2 Gy radiation had received GT3 (37.5 mg/kg, red) 24 h prior to irradiation. Vehicle control is colored blue. *The difference between GT3-treated and vehicle-treated groups was significant when equal variance between groups was assumed (p < 0.05). (C) Radiation (5.8 – blue, 6.5 – red or 7.2 – green Gy) induced fold change of citrulline concentrations in relation to pre-irradiation samples. (D) GT3 (37.5 mg/kg, red) induced fold change of citrulline concentrations in relation to pre-irradiation samples after exposure to 7.2 Gy radiation compared to vehicle (blue). Values less than 1.0 indicate a decreased citrulline concentration compared to its respective baseline value; values more than 1.0 would signify a citrulline concentration increase compared to baseline.
