Figure 1:
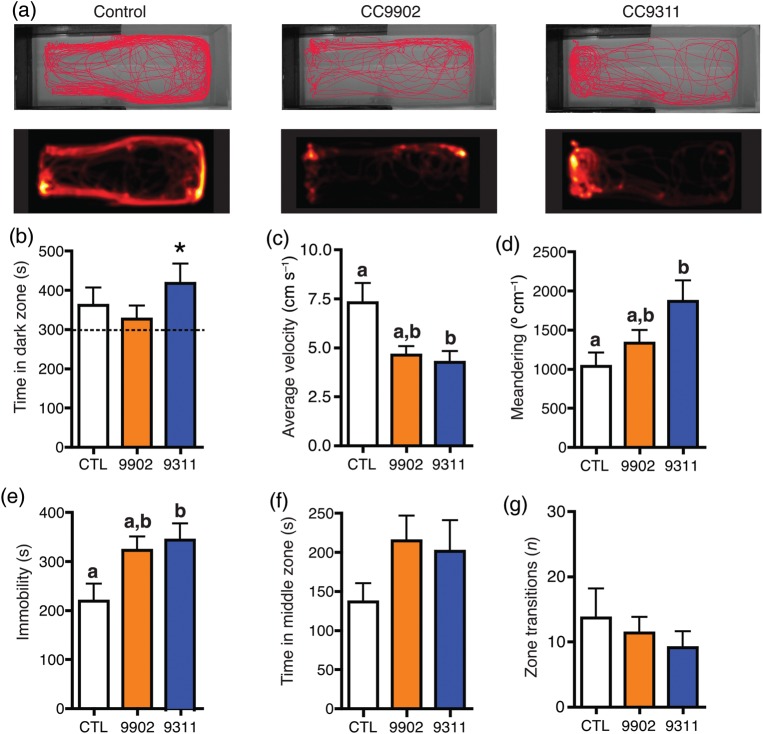
Exposure to Synechococcus for 3 days. (a) Fish from the control, Synechococcus sp. CC9902 and Synechococcus sp. CC9311 groups were individually placed in the light–dark preference test arena, and their location was recorded for 900 s. The upper trace illustrates the movement of one representative fish from each treatment over the duration of the trial. The heatmap (below) represents the movement of the same fish throughout the trial and is proportional to the time the fish spent in each pixel. (b) Control (CTL) and Synechococcus sp. CC9902 (9902) fish did not have a zone preference, whereas Synechococcus sp. CC9311 (9311) fish spent significantly more time in the dark zone, indicating increased anxiety. *Statistically significant difference from 300 s, P < 0.05. (c) Average velocity was significantly lower in the CC9311 group, but not in the CC9902 group, compared with the control group, nor in the CC9311 group compared with the CC9902 group. (d) Meandering was significantly greater in the CC9311 group, but not in the CC9902 group, compared with the control group, nor in the CC9311 group compared with the CC9902 group. (e) Immobility was significantly higher in the CC9311 group, but not in the CC9902 group, compared with the control group, nor in the CC9311 group compared with the CC9902 group. (f and g) There were no significant differences among groups in time spent in the middle zone or number of zone transitions. For b–g, control (n = 15), CC9902 (n = 13) and CC9311 (n = 16). Letters indicate statistically significant differences between the treatments (the same letter indicates lack of statistically significant differences).

