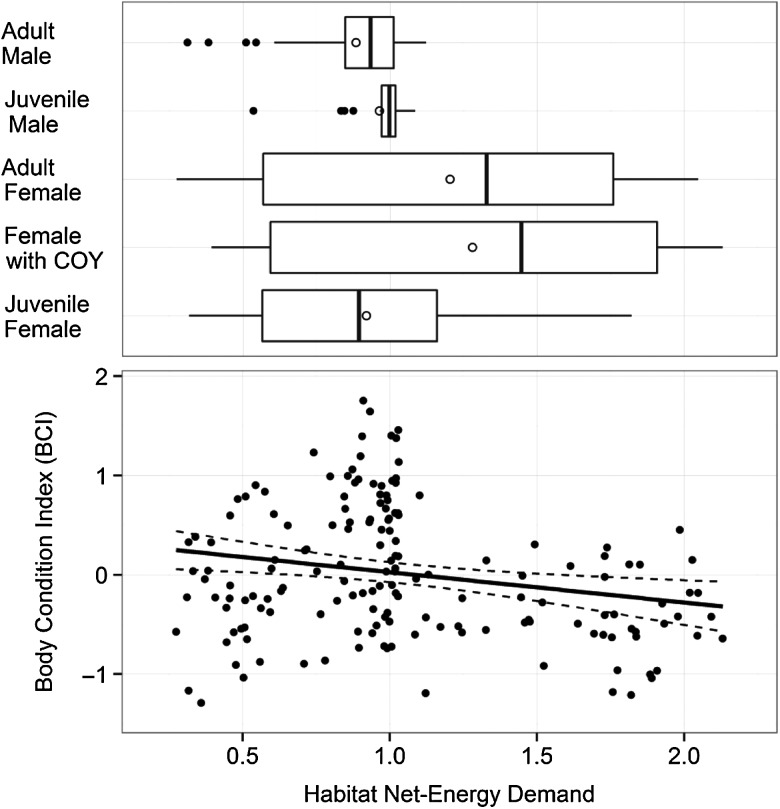
Figure 2:
The observed association between body condition index (BCI), habitat net-energy demand and reproductive class for 163 grizzly bears in Alberta, Canada. The best-fit line in the lower plot is the estimate from the global linear mixed-effect model in Table 3 and the dashed lines are the 95% confidence bands. Marginal boxplots in the upper plot show the habitat net-energy demand values associated with each reproductive class. The boxes represent the median, 25th and 75th percentiles, the lines represent 1.5 times the interquartile range, the filled circles represent outliers and the open circles the mean habitat net-energy demand. Habitat net-energy demand values represent predicted hair cortisol concentrations associated with habitat characteristics (detailed by Bourbonnais et al., 2013).

