Figure 4:
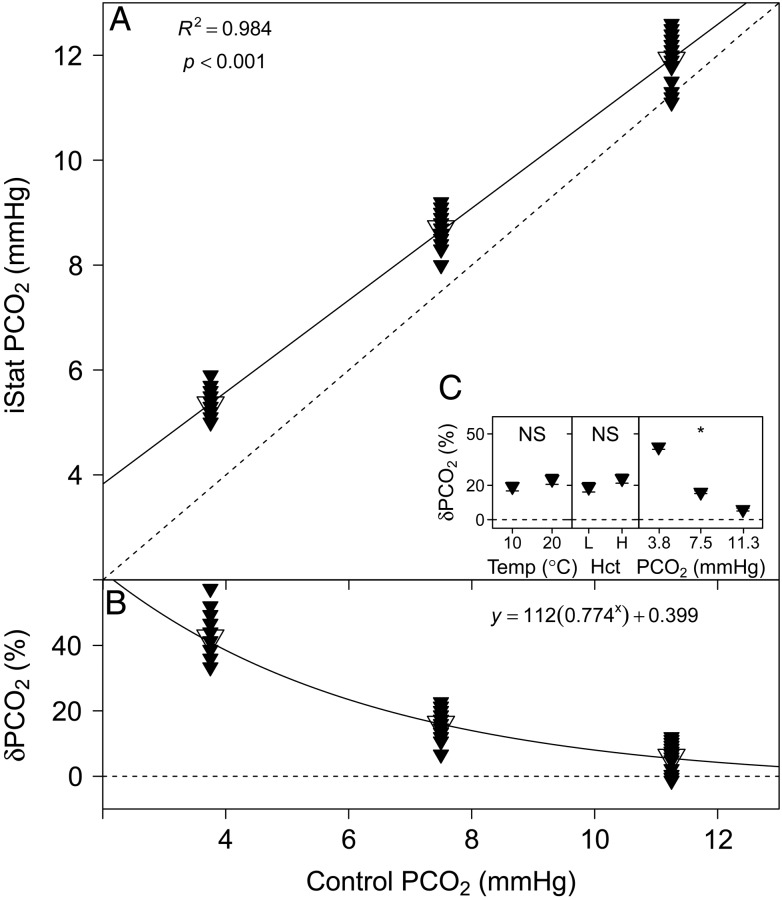
(A) Measurements of PCO2 with the i-STAT system vs. set PCO2. Mean values are indicated by the larger, open symbols. (B) The relative error of i-STAT PCO2 measurements, δPCO2 (expressed as a % ), [calculated as: (i-STAT PCO2 − control PCO2)/control PCO2 × 100] vs. control PCO2. Continuous lines represent the fitted models and dashed lines represent the lines of identity. (C) Effects of temperature (in °C ), Hct (L, low; H, high) and PCO2 (in mmHg) on δPCO2 (expressed as a %). Significant effects within treatments are indicated as NS for non-significant and ‘*’ at the P < 0.05 level. Data are means ± SEM, and statistical analysis was performed on the absolute δPCO2 values.

