
Figure 6:
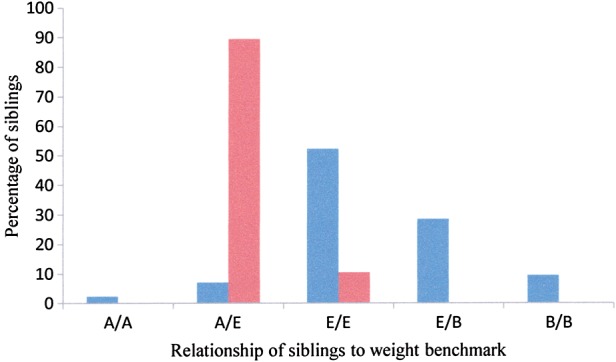
Percentage of sets of siblings at Coomallo Creek from 1970–1996 (blue, n = 42) and 2009–2012 (red, n = 19) in which both were above benchmark weight (A/A), one was above and the other equal to benchmark weight (A/E), both were equal (E/E), one was equal and one below (E/B) and both were below (B/B).