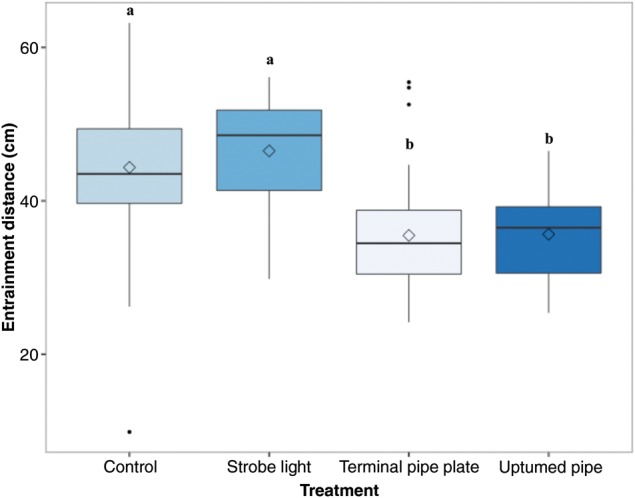
Figure 4:

The resultant distance from which fish were entrained into the diversion pipe. Boxplots of the distance from the centre of the pipe inlet that fish were swimming when an entrainment event began. Different letters represent statistically significant differences among treatments. Key: black line, median; box, interquartile range; whiskers, 1.5 × interquartile range; filled circles, outliers; and open diamond, mean. Mean proportions of fish diverted for each treatment (±SEM) are reported in the text. n = 6 trials for each treatment; 60 (±3) fish per trial.
