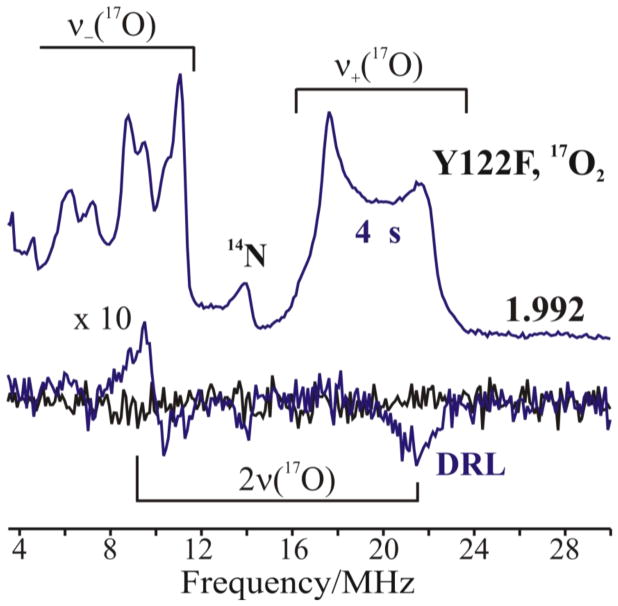
Figure 8.
Top: Davies pulsed 17O-ENDOR spectra recorded at g3 = 1.992 for X(Y122F) prepared with 17O2 gas and freeze quenched at 4 s (blue lines). Bottom: Corresponding 17O RD-PESTRE traces (blue trace) with null trace (black). The intensity of the RD-PESTRE spectrum is multiplied 10-fold relative to the ENDOR traces. The goalposts defined the υ+/υ− branches of the 17O-signal. Conditions: See Fig 7.

