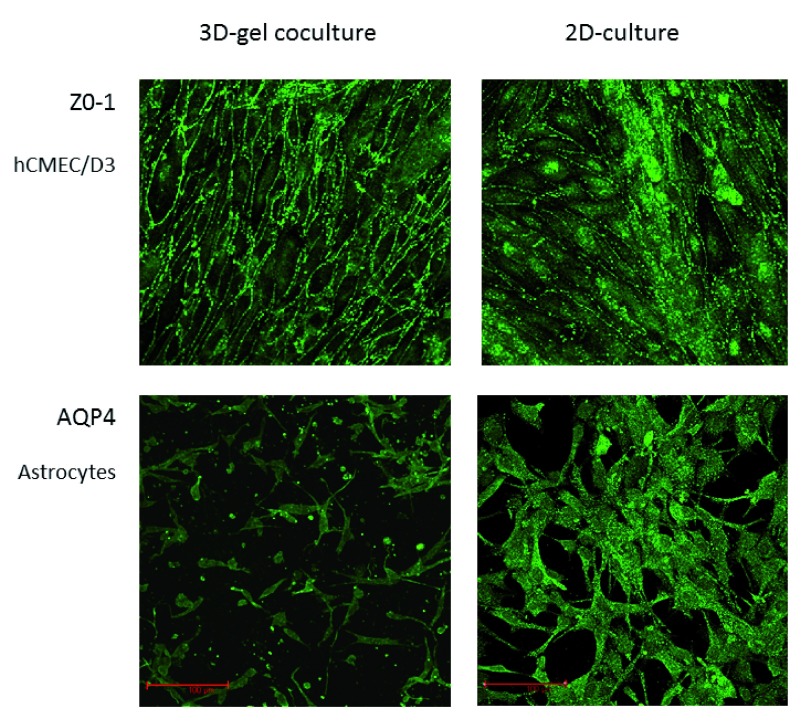
Figure 2. Expression of ZO-1 and AQP4 in 2D- and 3D-astrocyte cultures.
Immunofluorescence staining in situ for expression of ZO-1 in hCMEC/D3 cells (top) and AQP4 in human primary astrocytes (bottom) in 3D gel co-cultures (left) compared with conventional 2D solo cultures on a hard surface (right). 2D and 3D cultures were prepared, cultured, stained and imaged under the same conditions.

