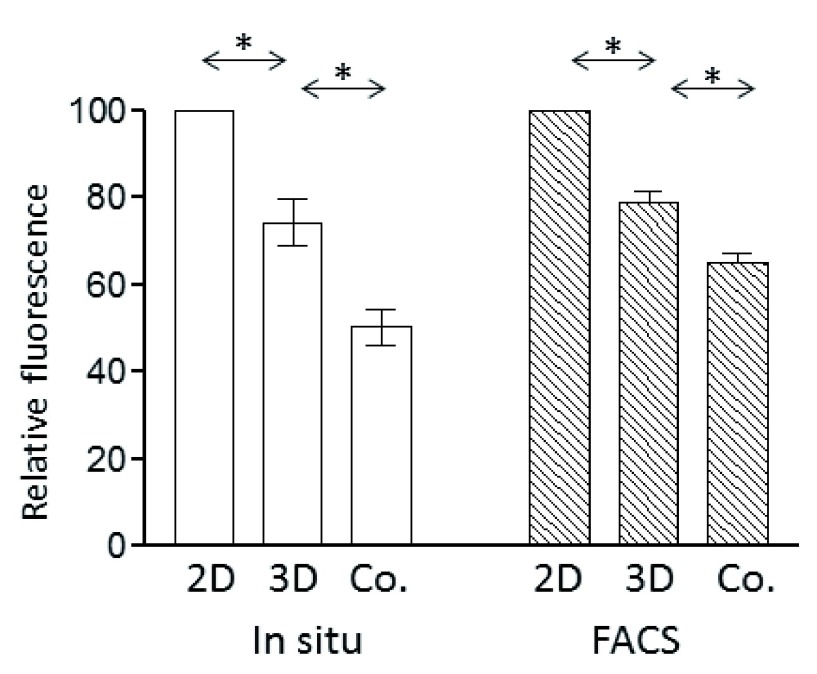
Figure 3. Modulation of astrocyte AQP4 in 3D barrier model.
Expression of AQP4 in 2D-astrocytes, 3D-astrocytes or astrocytes in 3D co-cultures (Co.) measured by immunofluorescence in situ and image analysis (left), or by isolation of the cells and flow cytometry (right). Fluorescence is expressed relative to the median value in 2D-astrocytes. Data points are the mean (±SEM) of median fluorescence values. 3D-astrocytes expressed lower levels of AQP4 than 2D-astrocytes and the expression of 3D-astrocytes further decreased in co-cultures (* P<0.05, paired t-test, n=3).

