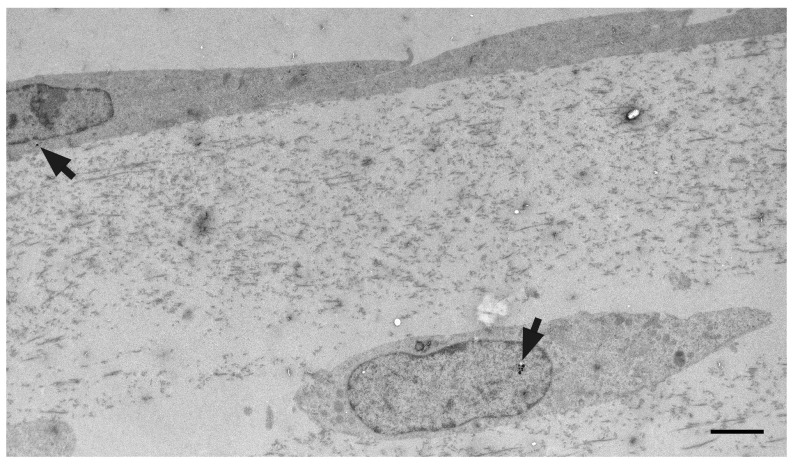
Figure 5. Co-culture model used to assess nanoparticle transmigration.
Electron micrograph of a 3D co-culture of human primary astrocytes and hCMEC/D3 cells after application of 8μg/ml glucose-coated gold nanoparticles to the endothelial surface. Nanoparticles (arrows) were detected both in the endothelium and the astrocytes. Scale bar = 500nm.

