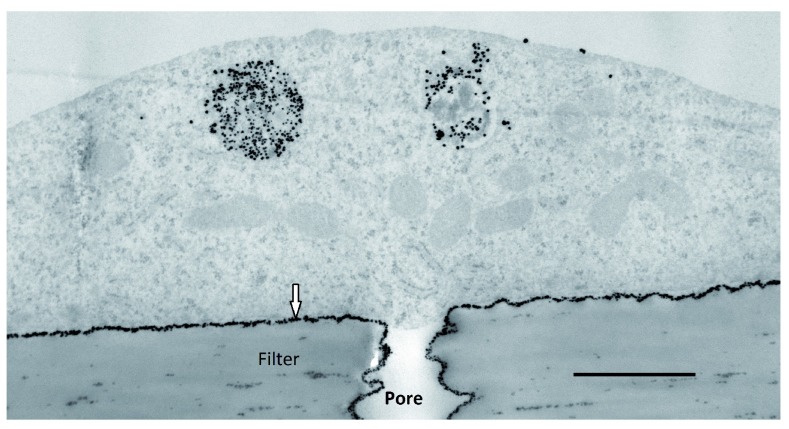
Figure 6. Limitations of transwells for assessing nanoparticle transmigration.
Electron micrograph of a section through hCMEC/D3 cells growing on a transwell filter, 1 hr after application of insulin-coated 4nm gold nanoparticles to the apical surface. The cells were fixed and nanoparticles visualised by silver enhancement. Nanoparticles (arrow) are trapped between the filter and basal membrane, except where there are pores (pore) in the filter. Scale bar = 1µm.

