
Figure 4.
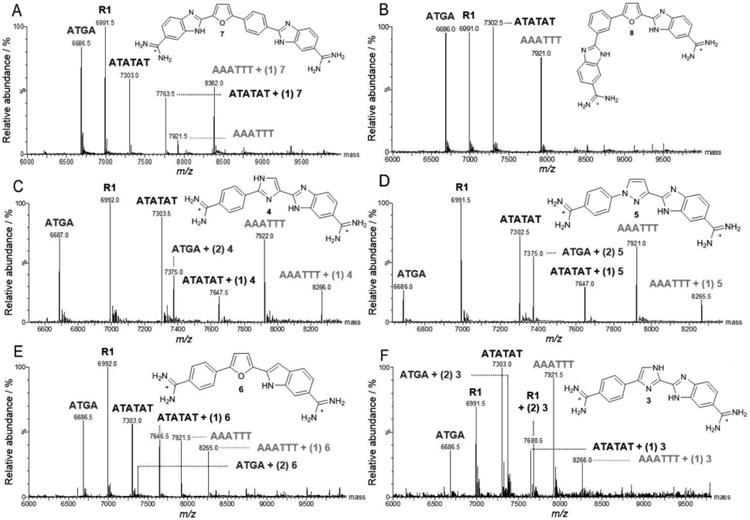
Spectra of DNA sequences titrated with compounds 3 to 8 analogs. Unbound DNAs are indicated by the sequence “name” above the respective peak (e.g. AAATTT, m/z 7,921.5) and ligand-DNA complex as “name + (n ligands bound) ligand name” (e.g. AAATTT + (1) 3, m/z 8,265.5). Molar ratios are expressed as [4:1] where ligand is to DNA. (A) 7, (B) 8, (C) 4, (D) 5, (E) 6, and (F) 3.