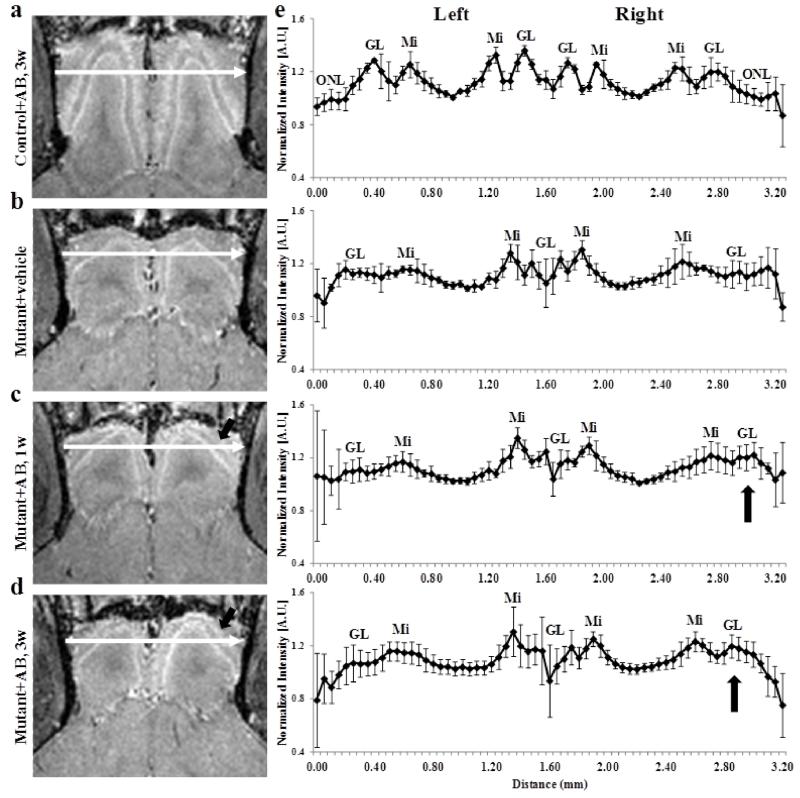
Figure 3.
horizontal T1 weighted images (MEMRI), at 50 μm isotropic resolution, taken 24 h after iv infusion of 100 mM MnCl2 solution of 7 week old control (a) 6 to 8 week old mutant mice after (b) 3 weeks of vehicle administration (c) 1 week of hAPP antibody administration and (d) 3 weeks after antibody administration to the right naris, and (e) the corresponding group intensity profiles. The intensity profile was taken across each OB from lateral side of the left OB to the right OB as shown by the arrows, and normalized to the minimum intensity for each OB. Group intensity profiles are the average and sd, for both left and right OB of 6 to 8 week old control after 3 weeks of antibody administration (n=3) and mutant after 3 weeks of vehicle administration (n=4), 1 week of hAPP antibody administration (n=5) and 3 weeks after antibody administration (n=7) to the right naris. ONL – olfactory nerve layer, GL – glomerular layer, Mi – mitral cell layer.

