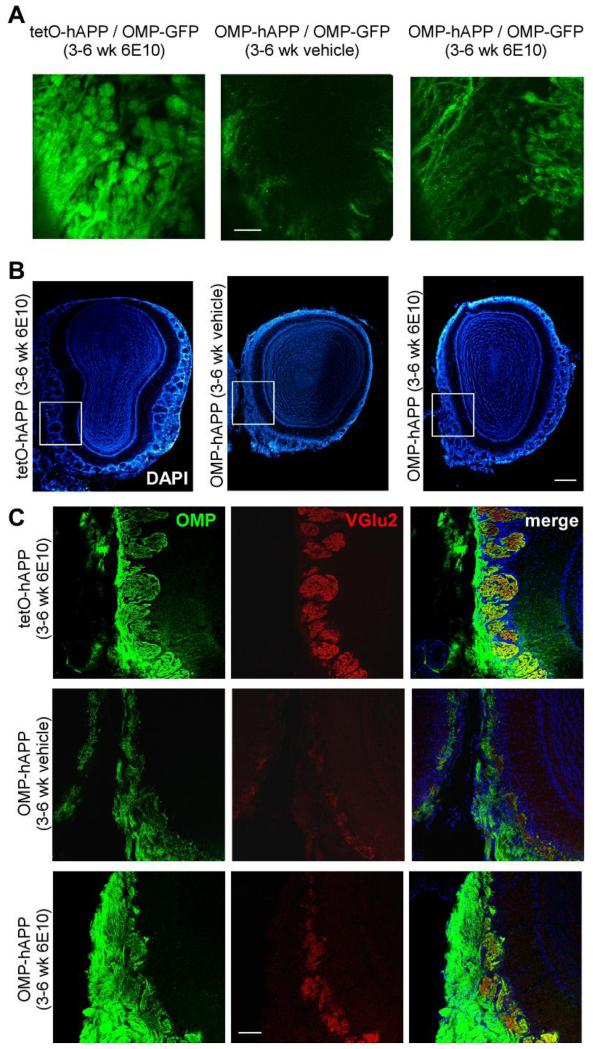
Figure 4.
(a) Whole-mount fluorescence imaging of OSNs axons and glomeruli in the OB from 6 week old control after 3 weeks of hAPP antibody (6E10) administration (left) and 6 week old mutant mice after 3 weeks of vehicle administration (middle) and hAPP antibody administration (right) to the right naris. (b) Low magnification images of DAPI nuclear staining for the 3 groups of animals (c) higher magnification images of OB sections from the 3 groups of animals at 6 week of age: control after 3 weeks of hAPP antibody administration (top row) and mutant after 3 weeks of vehicle administration (middle row) and hAPP antibody administration (bottom row). First column, OMP immunohistochemistry signal, marking mature OSNs; second column, VGlu2 immunohistochemistry signal, marking synaptic terminal of OSNs; last column, merge of the previous two channels. Scale bar – 4a, 200 μm; 4b low magnitude, 400 μm; 4c high magnitude, 100 μm.

