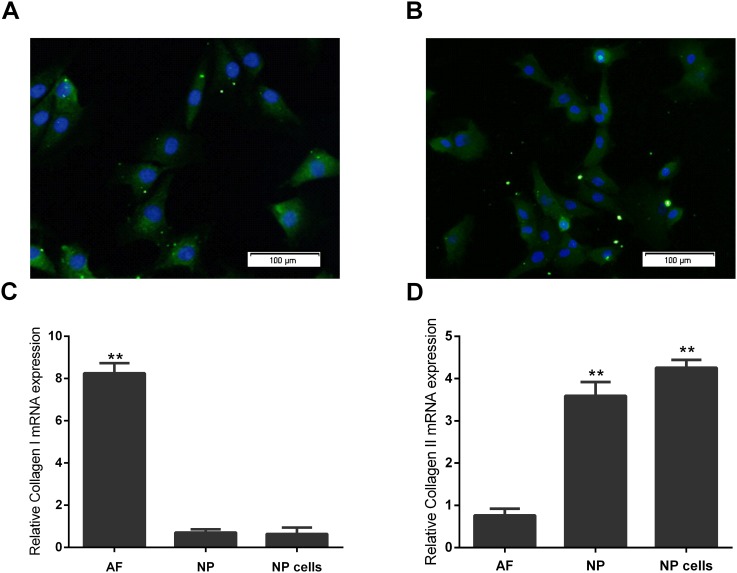
Fig 2. Immunofluorescence characterization and real-time quantitative PCR validation of primary cultured human NP cells.
(A) Fluorescence microscopy images showing collagenase type II was observed in NP cells. Nuclei were stained with DAPI, shown in blue. Images were acquired using laser scanning confocal microscopy under a 40×objective. (B) Fluorescence microscopy images showing aggrecan was observed in NP cells. Nuclei were stained with DAPI, shown in blue. Images were acquired using laser scanning confocal microscopy under a 40×objective. (C) Real-time RT-PCR analysis of negative NP cell marker gene collagen type I in NP cells, NP and AF. Real-time RT-PCR analysis was performed in triplicate and the expression levels of collagenase type I mRNAs were normalized to GAPDH mRNAs. (D) Real-time RT-PCR analysis of NP cell marker gene collagen type II in NP cells, NP and AF. Real-time RT-PCR analysis was performed in triplicate and the expression levels of collagenase type II mRNAs were normalized to GAPDH mRNAs. Error bars represent SD. As compared with control, ** indicates p<0.01.

