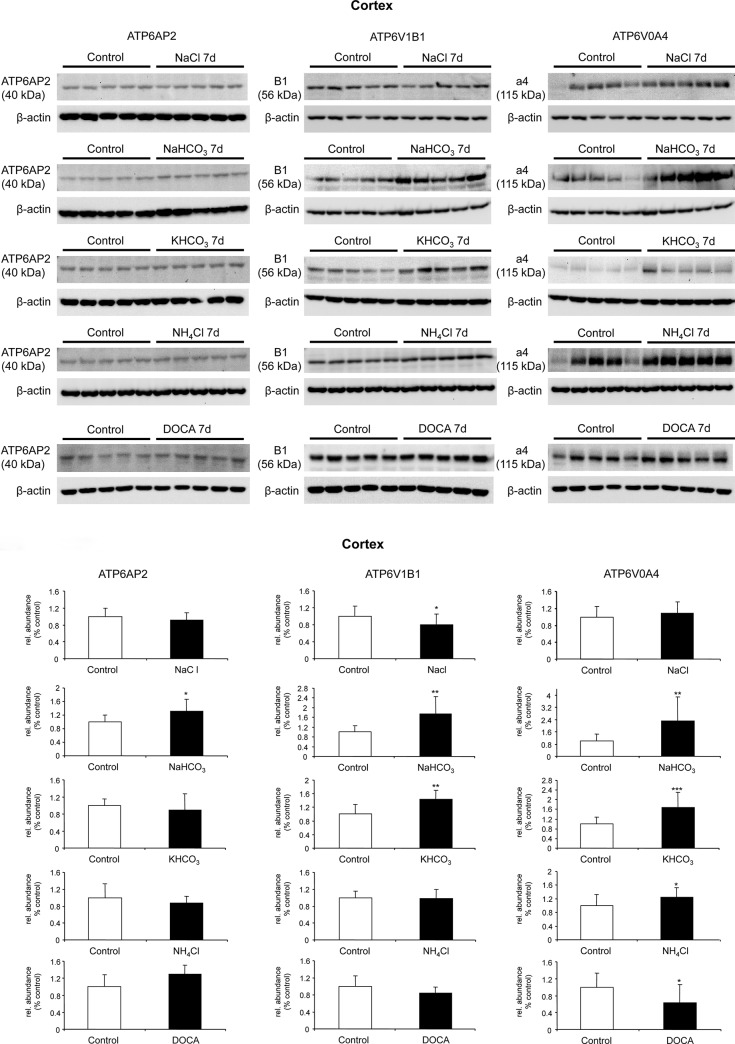
Fig 6. Regulated protein abundance of (P)RR/Atp6ap2 and the B1/Atp6v1b1 and a4/Atp6v0a4 H+-ATPase subunits in mouse kidney cortex.
Mice were treated with NaCl, NaHCO3, KHCO3, NH4Cl or DOCA for 7 days, and protein expression levels of (P)RR/Atp6ap2, and the B1/Atp6v1b1 and a4/Atp6v0a4 H+-ATPase subunits were examined by immunoblotting of total membrane fractions prepared from kidney cortex (A). All blots were stripped and reprobed for β-actin. (42 kDa), and the ratio of (P)RR: β-actin was calculated. Bar graphs (B) summarize data from the blots. Arithmetic means ± SD are shown, n = 5 animals/ group, *p ≤ 0.05, **p ≤ 0.01, ***p ≤ 0.001.

