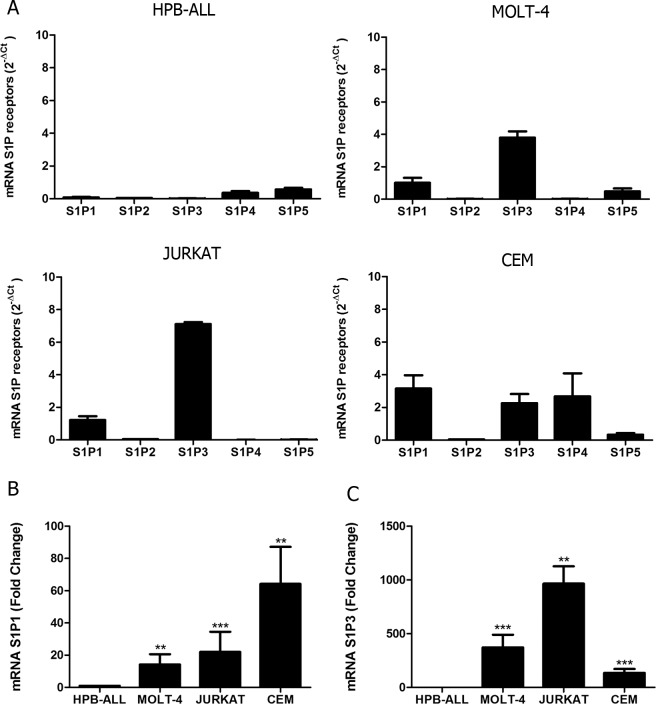
Fig 1. S1P receptors mRNA expression in human T-ALL blasts.
(A) Bars show S1P receptors mRNA expression analyzed by real time quantitative PCR, compared with the control Abelson (Abl) gene (2-ΔCt) in T-ALL (n = 1–2, with 3–6 biological replicates). (B) Bars shows S1P1 or (C) S1P3 mRNA expression analyzed by real time quantitative PCR, compared with the control Abelson (Abl). Fold change analysis were done using HPB-ALL as calibrator to normalize the expression of the receptors on the other T-ALL blasts. Statistical analysis was made with ΔCt values and significant differences are related to HPB-ALL cells. Results are expressed as mean ± SEM and were analyzed by Student’s t test and differences were considered statistically significant when p<0.05 (*), p< 0.01 (**) or p< 0.001(***) (n = 1–2, with 3–6 biological replicates).

