
Fig 5. S1P-induced migratory responses in checkerboard assays.
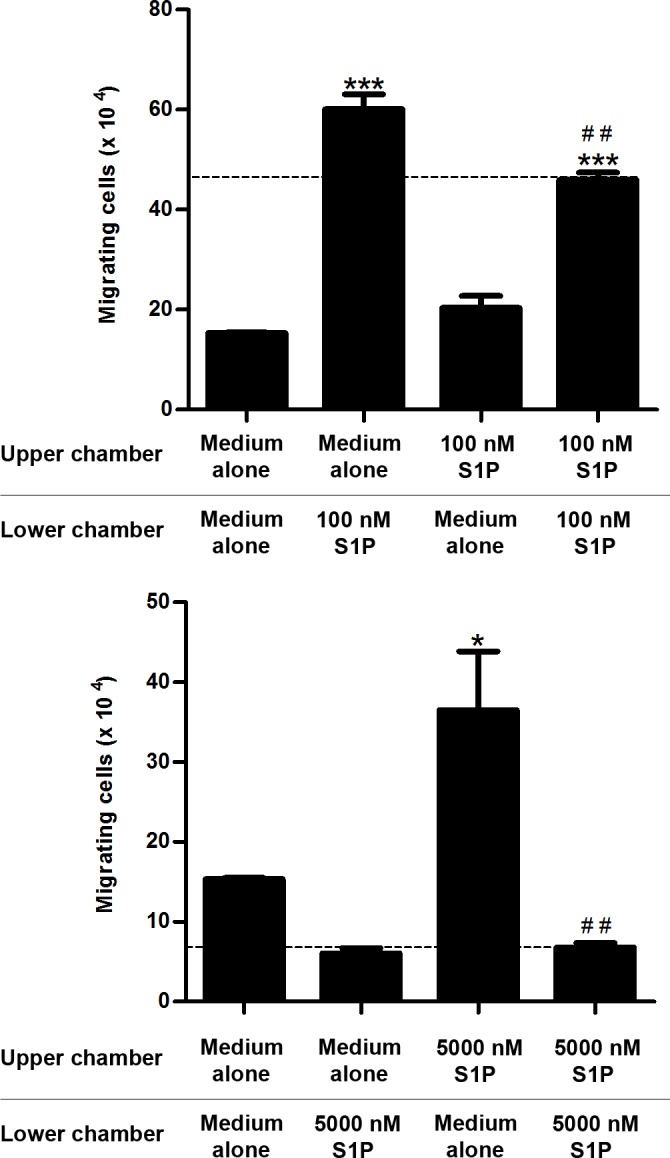
CEM cells were serum-starved for 2 h, applied to Transwell™ chambers containing different S1P concentrations in a checkerboard format and incubated for 4 hours. (A) S1P 100 nM or (B) S1P 5000 nM were added to upper and/or lower chamber as RPMI-BSA 0,1%. Results were analyzed by One-way ANOVA, followed by Tukey post-test and are expressed as mean ± SEM. Differences between wells with medium alone in upper and lower chambers and wells with S1P in upper and/or lower chamber were considered statistically significant when * p˂0.05, ** p ˂0.01 or *** p ˂0.001. Differences between wells with S1P in lower (100 nM) or upper (5000 nM) chambers and wells with S1P in both upper and lower chambers were considered statistically significant when # p˂0.05, ## p ˂0.01 or ### p ˂0.001 (n = 3).