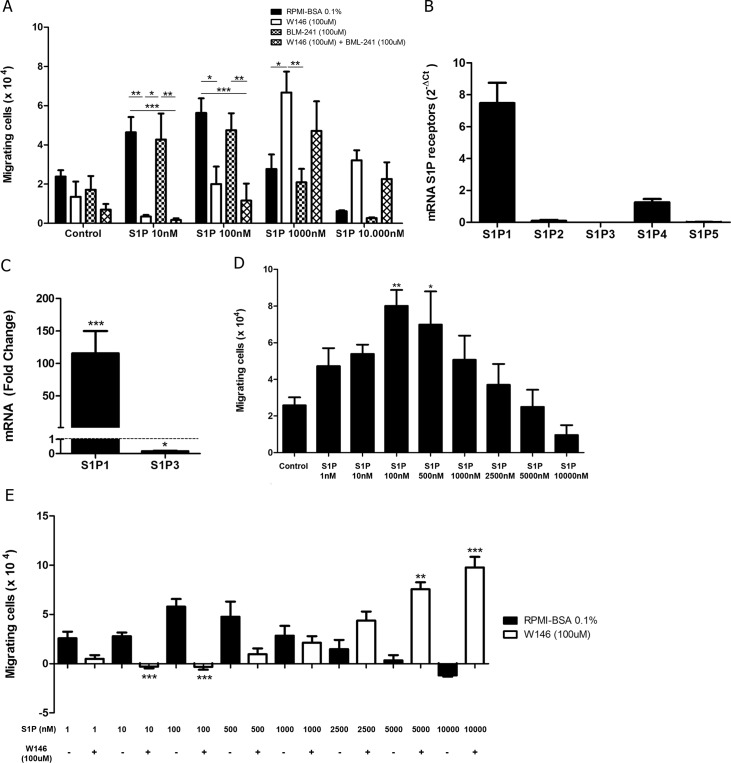
Fig 6. S1P3 is not involved in S1P-driven chemotactic responses of CEM cells.
(A) CEM cells were serum-starved for 2 h and pre-treated or not with W146 (100 μM) and/or BM-241 (100 μM). Cells were applied in Transwell™ chambers containing different S1P concentrations and incubated for 4 hours. Black bars correspond to pre-treatment with RPMI-BSA 0.1%; white bars correspond to pre-treatment with W146; grid bars correspond to pre-treatment with BML-241; and chess bars correspond to pre-treatment with W146 plus BML-241. Results were analyzed by Two-way ANOVA, followed by Bonferroni post-test (n = 3). (B) S1P receptors mRNA expression were analyzed by real time quantitative PCR, compared with the control Abelson (Abl) gene (2-ΔCt) in SU-DHL-1 cells (n = 4). (C) S1P1 and S1P3 mRNA expression was analyzed by real time quantitative PCR, compared with the control Abelson (Abl). Fold change analysis were done using HPB-ALL as calibrator to normalize the expression of S1P1 and S1P3 on SU-DHL-1 cells. Statistical analysis was made with ΔCt values and significant differences are related to HPB-ALL cells. Results were analyzed by Student’s t test (n = 4). (D) SU-DHL-1 cells were serum-starved for 2 h, applied to Transwell™ chambers containing different S1P concentrations and incubated for 4 hours. Results were analyzed by One-way ANOVA, followed by Tukey post-test (n = 3). (E) SU-DHL-1 cells were serum-starved for 2 h and treated or not with W146 (100 μM). Cells were applied to Transwell™ chambers containing different S1P concentrations and incubated for 4 hours. Values correspond to specific migration after subtracting the numbers of migrating cells in culture medium only. Black bars correspond to pre-treatment with RPMI-BSA 0.1% alone and white bars correspond to pre-treatment with W146. Results were analyzed by unpaired Student’s t test (n = 3). Results are expressed as mean ± SEM and differences were considered statistically significant when * p˂0.05, ** p ˂0.01 or *** p ˂0.001.

