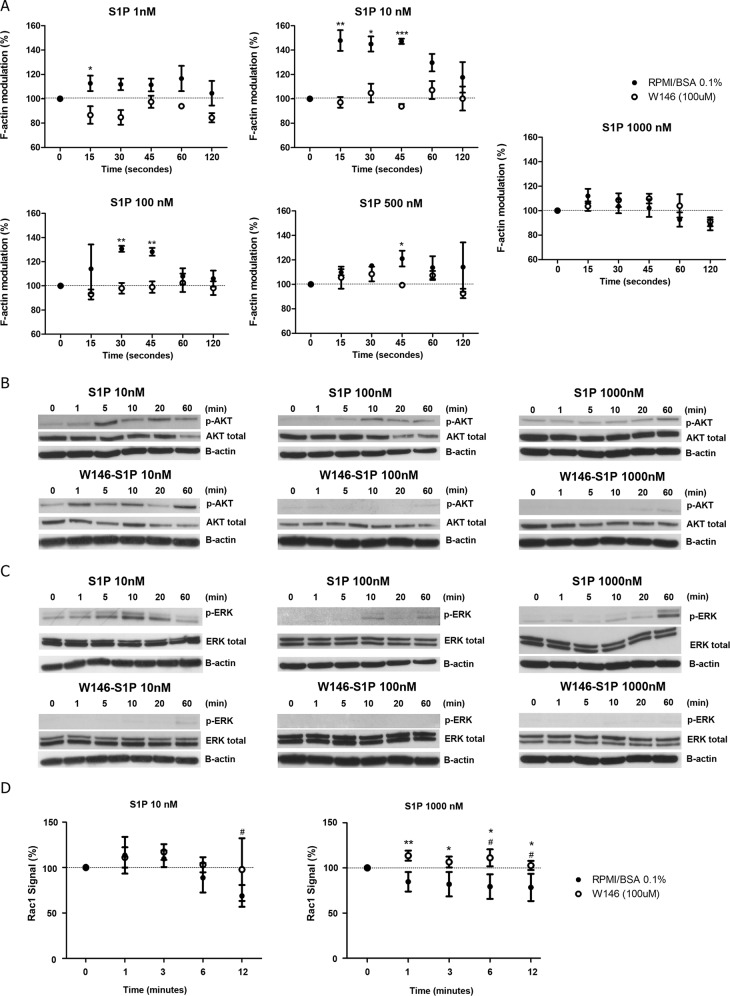
Fig 7. S1P modulates F-actin polymerization, AKT, ERK and Rac1 activity.
(A) Modulation of the actin cytoskeleton after stimulation by different S1P concentrations in CEM cells pre-treated or not with W146 (100 μM). Results are represented as [(MFI after addition of the ligand) / (MFI before addition of the ligand)] x 100. The MFI values obtained before the addition of S1P were arbitrarily set as 100% and correspond to the time zero. White circles correspond to cells previously treated with W146 (100 μM) and the black circles correspond to cells treated with RPMI-BSA 0.1%. Results are expressed by mean ± SEM and were analyzed by unpaired Student’s t test (n = 3). Differences were considered statistically significant when * p˂0.05, ** p ˂0.01 or *** p ˂0.001 (B) AKT and (C) ERK1/2 activation after stimulation of CEM cells, with different S1P concentrations, being pre-treated or not with W146 (100 μM). Protein extracts were analyzed by Western-blot with AKT, phosphorylated-AKT, ERK1/2 and phosphorylated-ERK-1/2 specific antibodies. Representative western-blots images are shown (n = 3). (D) Rac1 activity after stimulation of CEM cells, pre-treated or not with W146 (100 μM), with different S1P concentrations was accessed by G-LISA. Optical density (OD) was detected in 490 nm. Results are represented as [(OD after addition of the ligand) / (OD before addition of the ligand)] x 100. OD values obtained before the addition of S1P were arbitrarily set as 100% and correspond to the time zero. Black circles correspond pre-treatment with RPMI-BSA 0.1% and white circles correspond to pre-treatment with W146 (100 μM). Results and are expressed as mean ± SEM. Differences between distinct time points and control (time zero) were analyzed by One-way ANOVA, followed by Dunnett post-test and were considered statistically significant when # p˂0.05, ## p ˂0.01 or ### p ˂0.001. Differences between pre-treatment with RPMI-BSA 0.1% and pre-treatment with W146 (100 μM) were analyzed by unpaired Student T test (n = 1, with 2 biological replicates in duplicate). Differences were considered statistically significant when * p˂0.05, ** p ˂0.01 or *** p ˂0.001.

