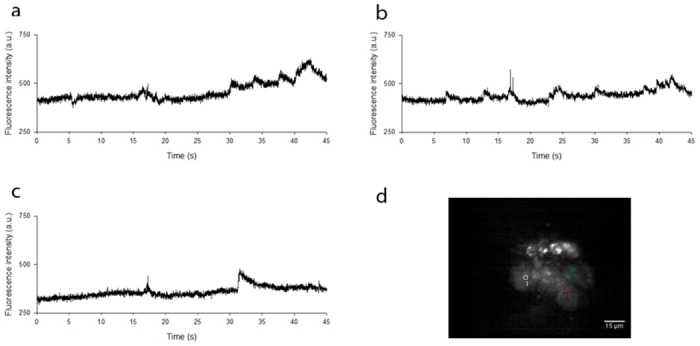
Fig 5. Localisation of changes in fluorescence intensity.

(a), (b) and (c) show widefield two-photon excited fluorescence intensities within three adjacent live neuronal cell bodies loaded with Fluo-4 AM, acquired at a frame rate of 100 Hz over a duration of 45 seconds. This confirms that the measured change in fluorescence signal intensity with time was not global across the image, but was instead localised to individual cell bodies at different times. (d) An image of the field of view and accompanying ROIs from which the measurements were taken.
