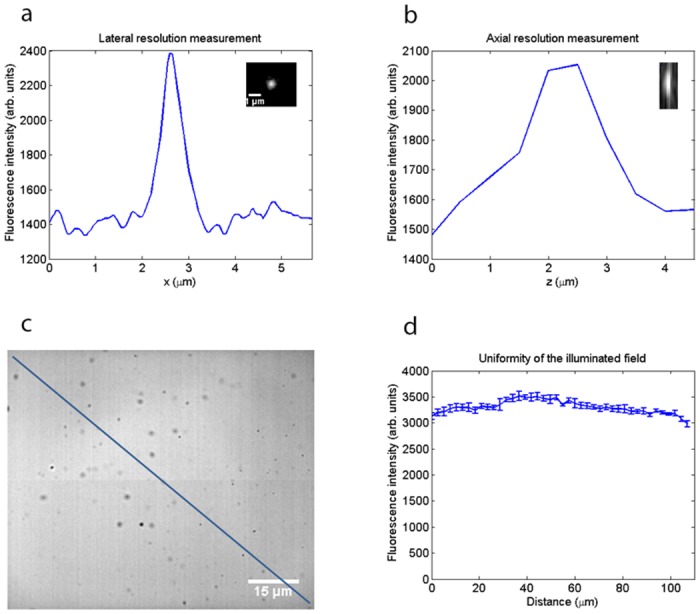
Fig 7. Resolution measurements and evaluation of the uniformity of the illuminated field.

(a) Lateral intensity profile through a 200 nm bead imaged using a 60x/1.35 NA oil immersion lens at an excitation wavelength of 820 nm, showing the lateral resolution to be 0.55 μm from the full width at half maximum. (b) Axial intensity profile of the same bead, showing that the axial resolution is 1.5 μm. (c) Widefield two-photon image of a fluorescent Perspex block used to evaluate the uniformity of the illuminated field. Scale bar = 15 μm. (d) Intensity profile along the diagonal line in (c), showing the fluorescence intensity varied by less than 10% across the field of view.
