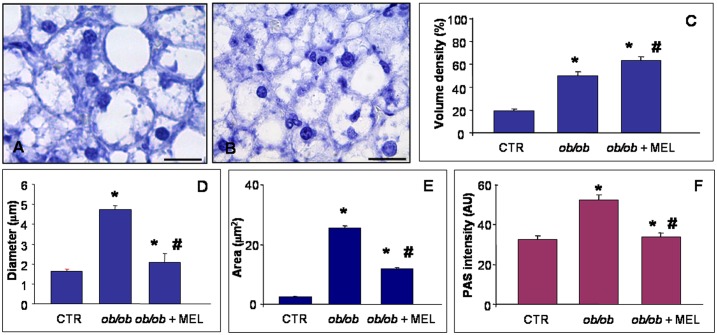
Fig 2. Liver lipid droplets and glycogen.
Hepatic histological staining of ob/ob (A) and ob/ob treated with melatonin (B), showing macrosteatosis and microsteatosis respectively. Haematoxylin staining. Scale bars: 20 μm. The graphs summarized the morphometrical analyses of lipid droplet volume density (C), diameter (D) and area (E) and PAS glycogen intensity (F). * p<0.05 vs lean mice and # p<0.05 vs ob/ob mice.

