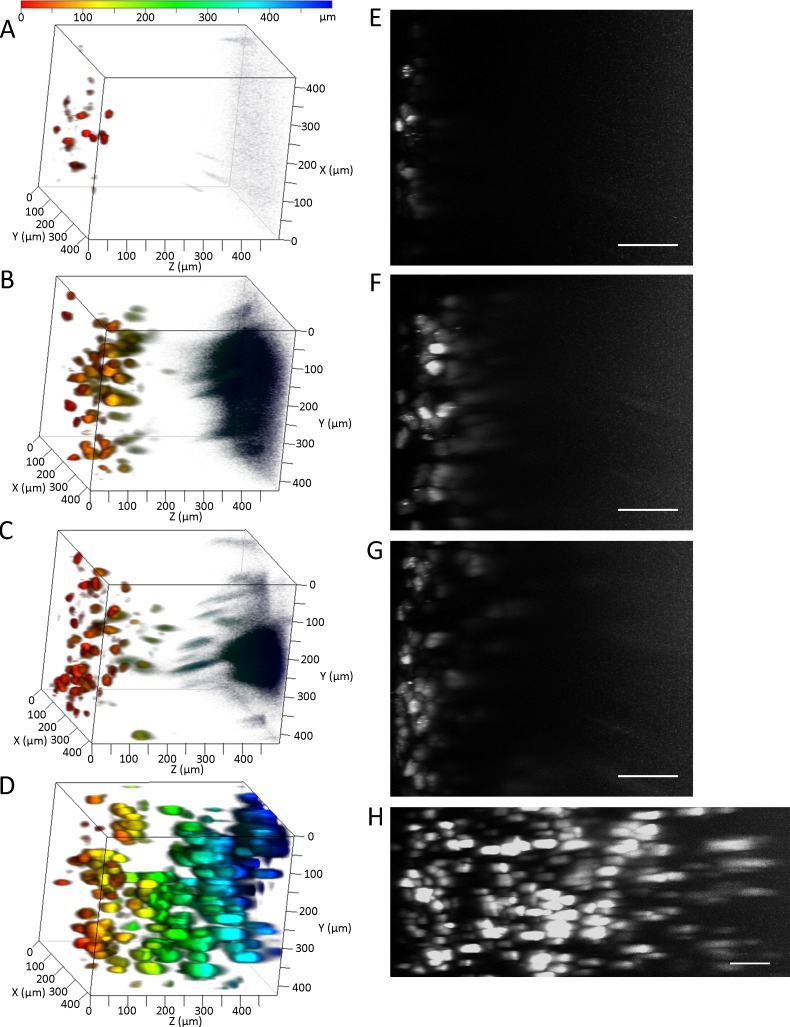
Fig 1. Comparison of tissue clearing methods.
(A, E) PBS, (B, F) ClearT2, (C, G) SeeDB, and (D, H) CUBIC. ZsGreen1 expression in the liver was detected by CLSM. (A–D) Depth coding. The color chart indicates depth on the Z-axis. (E–H) Maximum intensity projection (X–Z plane). Scale bar: 100 μm. Acquisition conditions: lens, 20× dry; laser, 488 nm; output, 5%; emission, 492–540 nm; master gain, (A, E) 432–1200, (B, F) 433–1129, (C, G) 405–1129, and (D, H) 492–1115.

