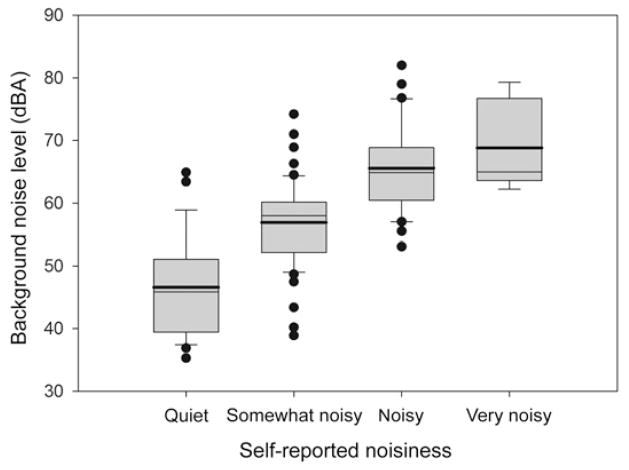
Figure 4.
Box plot of background noise level as a function of self-reported noisiness. The boundaries of the box represent the 25th and 75th percentile. The thinner and thicker lines within the box mark the median and mean, respectively. Error bars indicate the 10th and 90th percentiles. Solid circles are outlying data points.

