
Fig. 1.
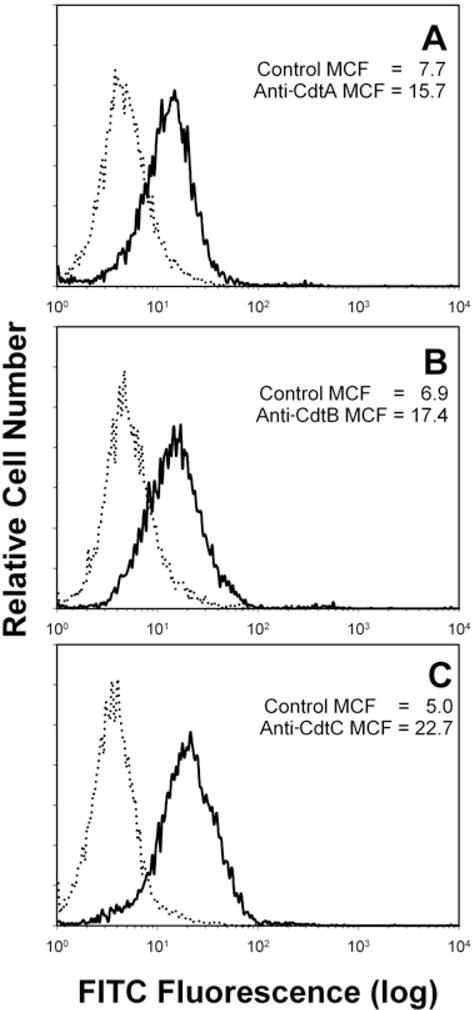
Detection of Cdt subunits associated with the Jurkat cell surface following treatment with Cdt holotoxin. Jurkat cells were exposed to Cdt holotoxin (2 μg ml−1) for 2 h and then treated with control murine IgG (dotted lines), anti-CdtA mAb [solid line in (A); mAb Cdt162]; anti-CdtB mAb [solid line in (B); mAb Cdt171] or anti-CdtC mAb [solid line in (C); mAb Cdt112]. Cells were then sequentially stained with goat anti-mouse Ig conjugated to biotin and streptavidin conjugated to FITC and analysed by flow cytometry. FITC fluorescence is plotted versus relative cell number. Numbers represent the mean channel fluorescence (MCF); at least 10 000 cells were analysed per sample. Results are representative of three experiments.