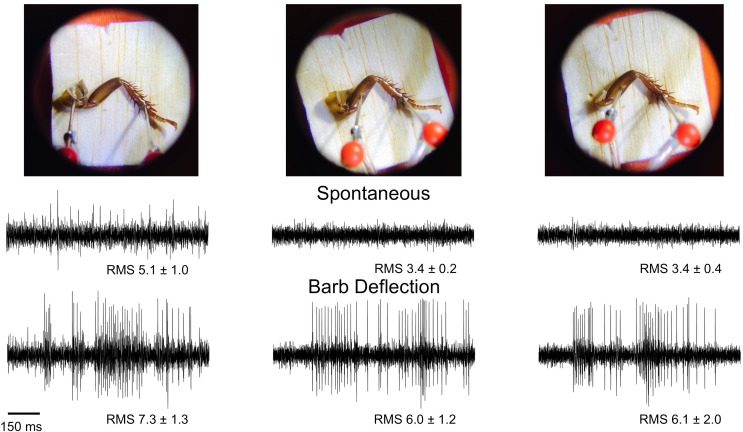
Fig 7. Neural Recordings in Different Electrode Configurations.
Electrodes were first placed in the coxa and tibia tarsus joint; spontaneous rate was recorded for 10 seconds, followed by 10 seconds of lightly touching the tibial barbs with a plastic probe. The coxa electrode was then moved to the femur, and a similar recording of spontaneous activity and tactile activity done. Finally, the coxa was removed with forceps, and the measurements of neural signals repeated. The average root mean square, a measure of signal amplitude, for all 8 legs is shown underneath the traces and is reported in arbitrary A/D (analog to digital) conversion units.

