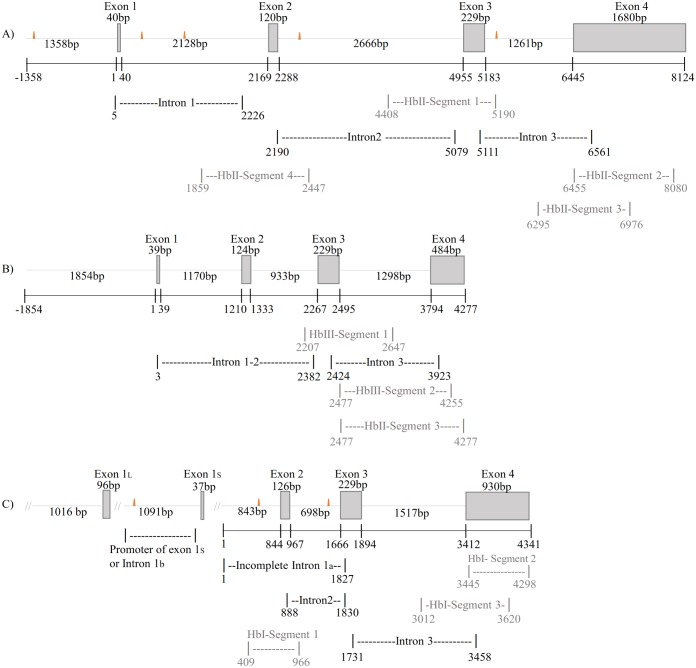
Fig 1. Lucina pectinata hemoglobin gene structures.
Schematic diagram of L. pectinata’s hemoglobin genes. The exon regions are represented by boxes and introns as dashed lines. The orange triangles represent the location of MITE-like element found in these genes. The sequences preceding exon(s) 1 are the promoter regions obtained by the GW method. A) Schematic diagram of HbII gene structure. Shown are the localization and length of the XL-PCR products amplified to determine the intron sizes and overlapping PCR products used to verify the 3’ end of the gene. The total length of the four exons and three introns in the L. pectinata HbII gene is 8,055 bp. B) Schematic diagram of HbIII gene structure. The exon regions, the localization and length of the XL-PCR products and overlapping PCR products are indicated as for the HbII gene in A. The total length of the four exons and three introns in the L. pectinata HbIII gene is 4,277 bp. C) Proposed schematic diagram of HbI partial gene structure. The localization and length of PCR amplified to determine the intron sizes and overlapping products are shown. HbI incomplete gene length (from incomplete intron 1a to the end of exon 4) is 4,341 bp. Alternate first exons are label exon 1L and exon 1S.

